Zip Codes with the Highest Percentage of Population Employed in Legal Services & Support in Paris, TX
RELATED REPORTS & OPTIONS
Legal Services & Support
Paris
Compare Zip Codes
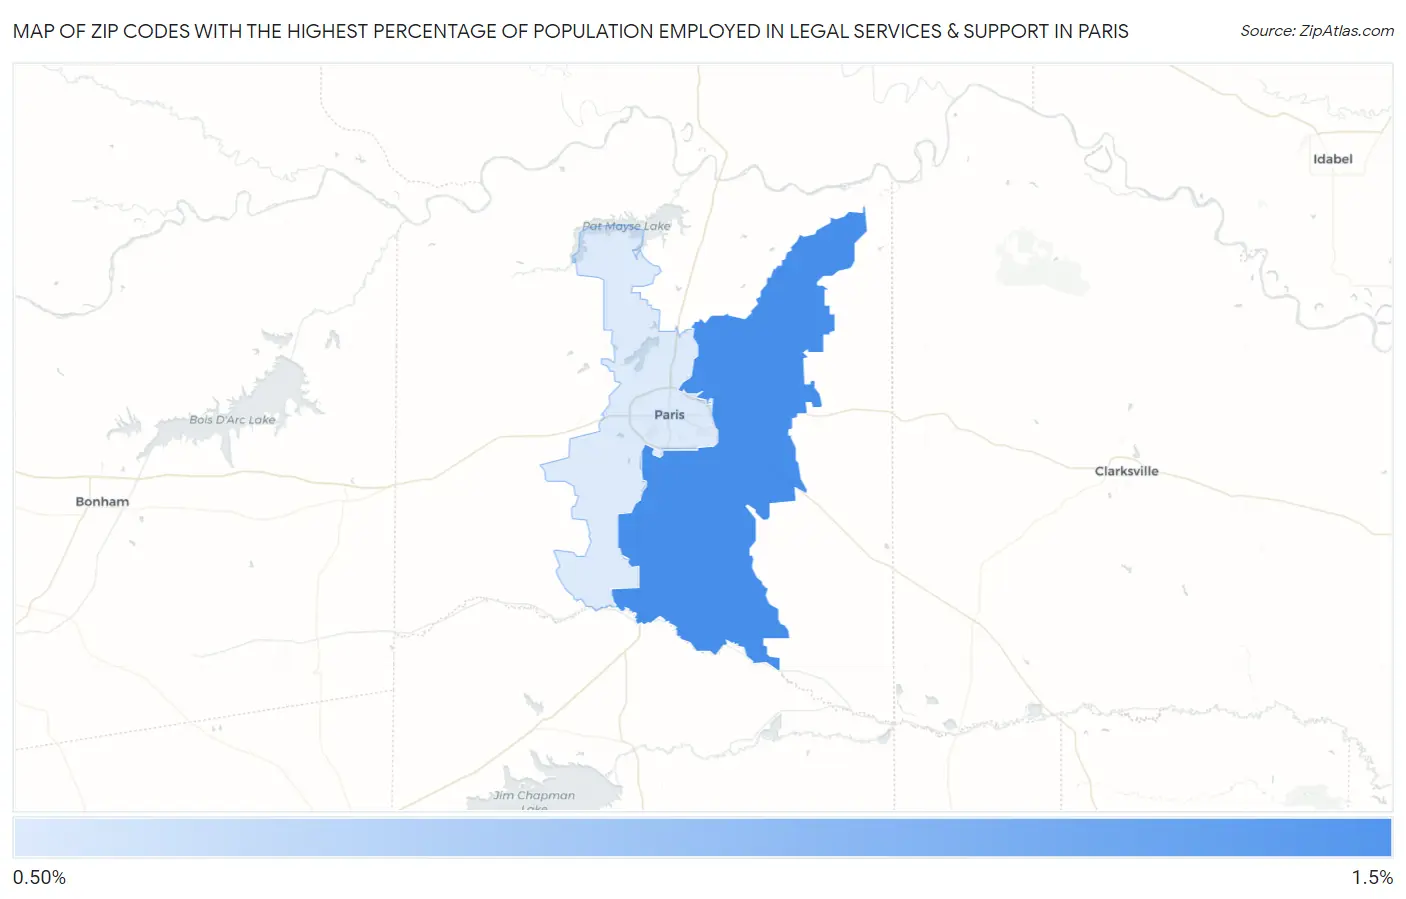
Map of Zip Codes with the Highest Percentage of Population Employed in Legal Services & Support in Paris
0.50%
1.1%
Zip Codes with the Highest Percentage of Population Employed in Legal Services & Support in Paris, TX
| Zip Code | % Employed | vs State | vs National | |
| 1. | 75462 | 1.1% | 1.0%(+0.082)#396 | 1.2%(-0.094)#7,240 |
| 2. | 75460 | 0.50% | 1.0%(-0.506)#742 | 1.2%(-0.682)#12,604 |
1
Common Questions
What are the Top Zip Codes with the Highest Percentage of Population Employed in Legal Services & Support in Paris, TX?
Top Zip Codes with the Highest Percentage of Population Employed in Legal Services & Support in Paris, TX are:
What zip code has the Highest Percentage of Population Employed in Legal Services & Support in Paris, TX?
75462 has the Highest Percentage of Population Employed in Legal Services & Support in Paris, TX with 1.1%.
What is the Percentage of Population Employed in Legal Services & Support in Paris, TX?
Percentage of Population Employed in Legal Services & Support in Paris is 0.57%.
What is the Percentage of Population Employed in Legal Services & Support in Texas?
Percentage of Population Employed in Legal Services & Support in Texas is 1.0%.
What is the Percentage of Population Employed in Legal Services & Support in the United States?
Percentage of Population Employed in Legal Services & Support in the United States is 1.2%.