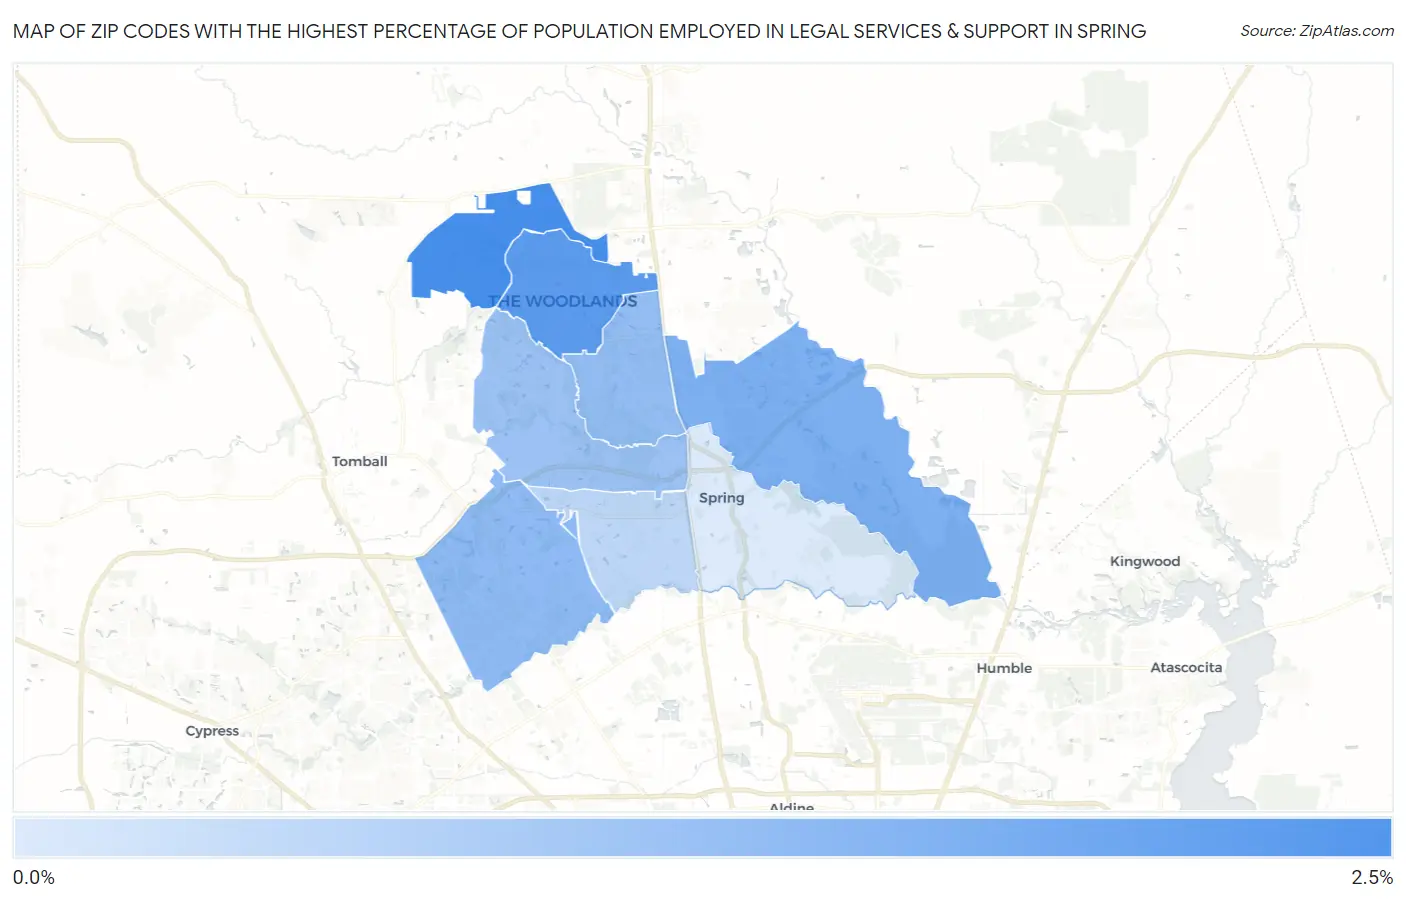
Zip Codes with the Highest Percentage of Population Employed in Legal Services & Support in Spring, TX
RELATED REPORTS & OPTIONS
Legal Services & Support
Spring
Compare Zip Codes
Map of Zip Codes with the Highest Percentage of Population Employed in Legal Services & Support in Spring
0.47%
2.1%
Zip Codes with the Highest Percentage of Population Employed in Legal Services & Support in Spring, TX
| Zip Code | % Employed | vs State | vs National | |
| 1. | 77382 | 2.1% | 1.0%(+1.08)#168 | 1.2%(+0.903)#3,253 |
| 2. | 77381 | 1.9% | 1.0%(+0.887)#196 | 1.2%(+0.711)#3,745 |
| 3. | 77386 | 1.5% | 1.0%(+0.505)#266 | 1.2%(+0.329)#4,999 |
| 4. | 77379 | 1.3% | 1.0%(+0.313)#317 | 1.2%(+0.137)#5,828 |
| 5. | 77380 | 1.3% | 1.0%(+0.266)#331 | 1.2%(+0.090)#6,076 |
| 6. | 77389 | 1.2% | 1.0%(+0.161)#364 | 1.2%(-0.015)#6,712 |
| 7. | 77388 | 0.81% | 1.0%(-0.202)#522 | 1.2%(-0.378)#9,391 |
| 8. | 77373 | 0.47% | 1.0%(-0.536)#785 | 1.2%(-0.712)#12,983 |
1
Common Questions
What are the Top 5 Zip Codes with the Highest Percentage of Population Employed in Legal Services & Support in Spring, TX?
Top 5 Zip Codes with the Highest Percentage of Population Employed in Legal Services & Support in Spring, TX are:
What zip code has the Highest Percentage of Population Employed in Legal Services & Support in Spring, TX?
77382 has the Highest Percentage of Population Employed in Legal Services & Support in Spring, TX with 2.1%.
What is the Percentage of Population Employed in Legal Services & Support in Spring, TX?
Percentage of Population Employed in Legal Services & Support in Spring is 0.48%.
What is the Percentage of Population Employed in Legal Services & Support in Texas?
Percentage of Population Employed in Legal Services & Support in Texas is 1.0%.
What is the Percentage of Population Employed in Legal Services & Support in the United States?
Percentage of Population Employed in Legal Services & Support in the United States is 1.2%.