Zip Codes with the Highest Percentage of Population Employed in Legal Services & Support in Harlingen, TX
RELATED REPORTS & OPTIONS
Legal Services & Support
Harlingen
Compare Zip Codes
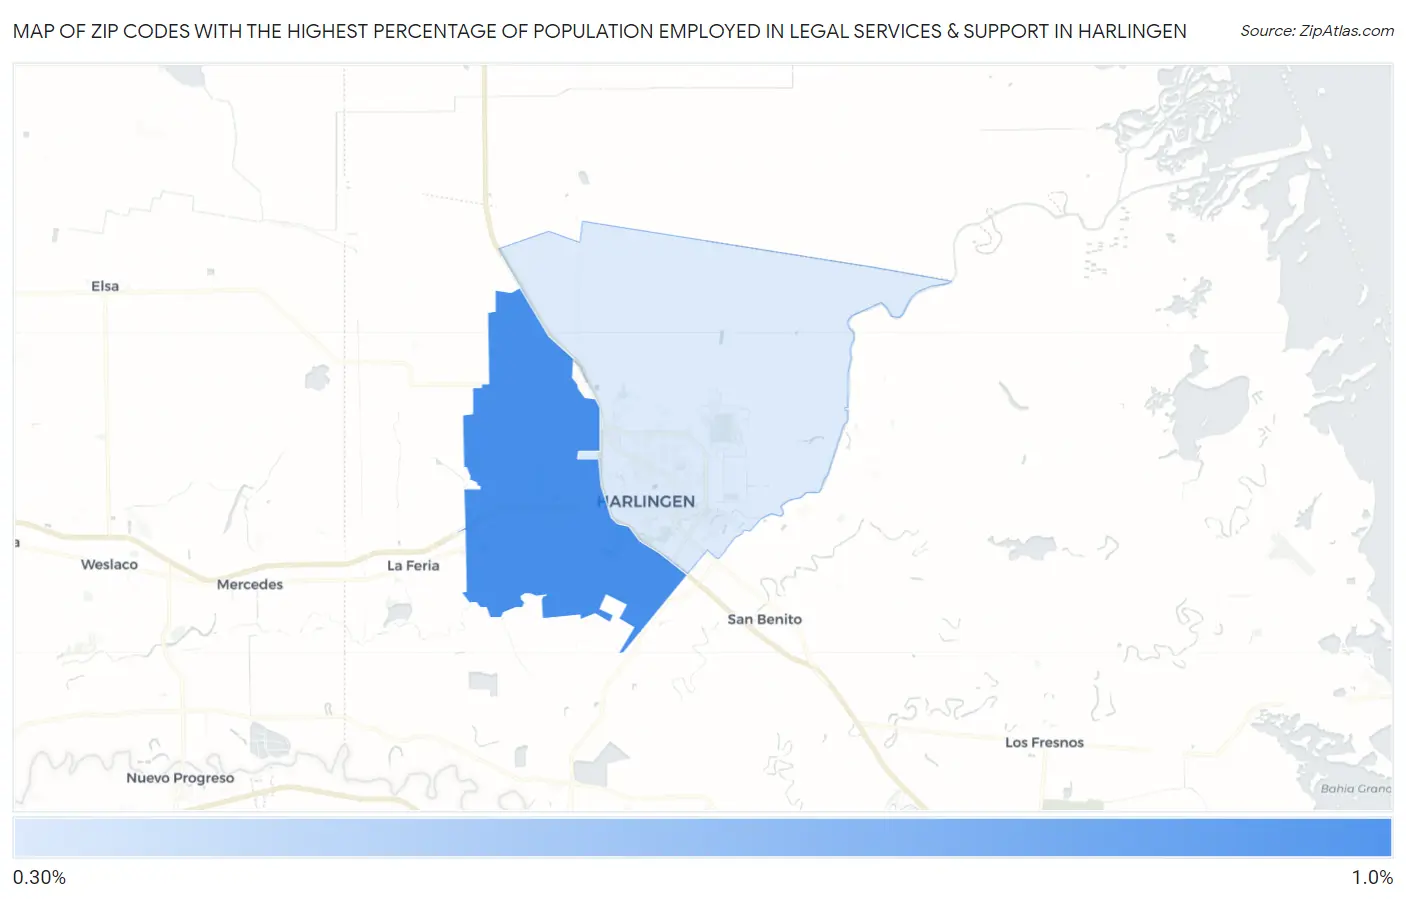
Map of Zip Codes with the Highest Percentage of Population Employed in Legal Services & Support in Harlingen
0.37%
0.98%
Zip Codes with the Highest Percentage of Population Employed in Legal Services & Support in Harlingen, TX
| Zip Code | % Employed | vs State | vs National | |
| 1. | 78552 | 0.98% | 1.0%(-0.028)#446 | 1.2%(-0.204)#7,961 |
| 2. | 78550 | 0.37% | 1.0%(-0.639)#868 | 1.2%(-0.814)#14,210 |
1
Common Questions
What are the Top Zip Codes with the Highest Percentage of Population Employed in Legal Services & Support in Harlingen, TX?
Top Zip Codes with the Highest Percentage of Population Employed in Legal Services & Support in Harlingen, TX are:
What zip code has the Highest Percentage of Population Employed in Legal Services & Support in Harlingen, TX?
78552 has the Highest Percentage of Population Employed in Legal Services & Support in Harlingen, TX with 0.98%.
What is the Percentage of Population Employed in Legal Services & Support in Harlingen, TX?
Percentage of Population Employed in Legal Services & Support in Harlingen is 0.61%.
What is the Percentage of Population Employed in Legal Services & Support in Texas?
Percentage of Population Employed in Legal Services & Support in Texas is 1.0%.
What is the Percentage of Population Employed in Legal Services & Support in the United States?
Percentage of Population Employed in Legal Services & Support in the United States is 1.2%.