Zip Codes with the Highest Percentage of Population Employed in Legal Services & Support in Mcallen, TX
RELATED REPORTS & OPTIONS
Legal Services & Support
Mcallen
Compare Zip Codes
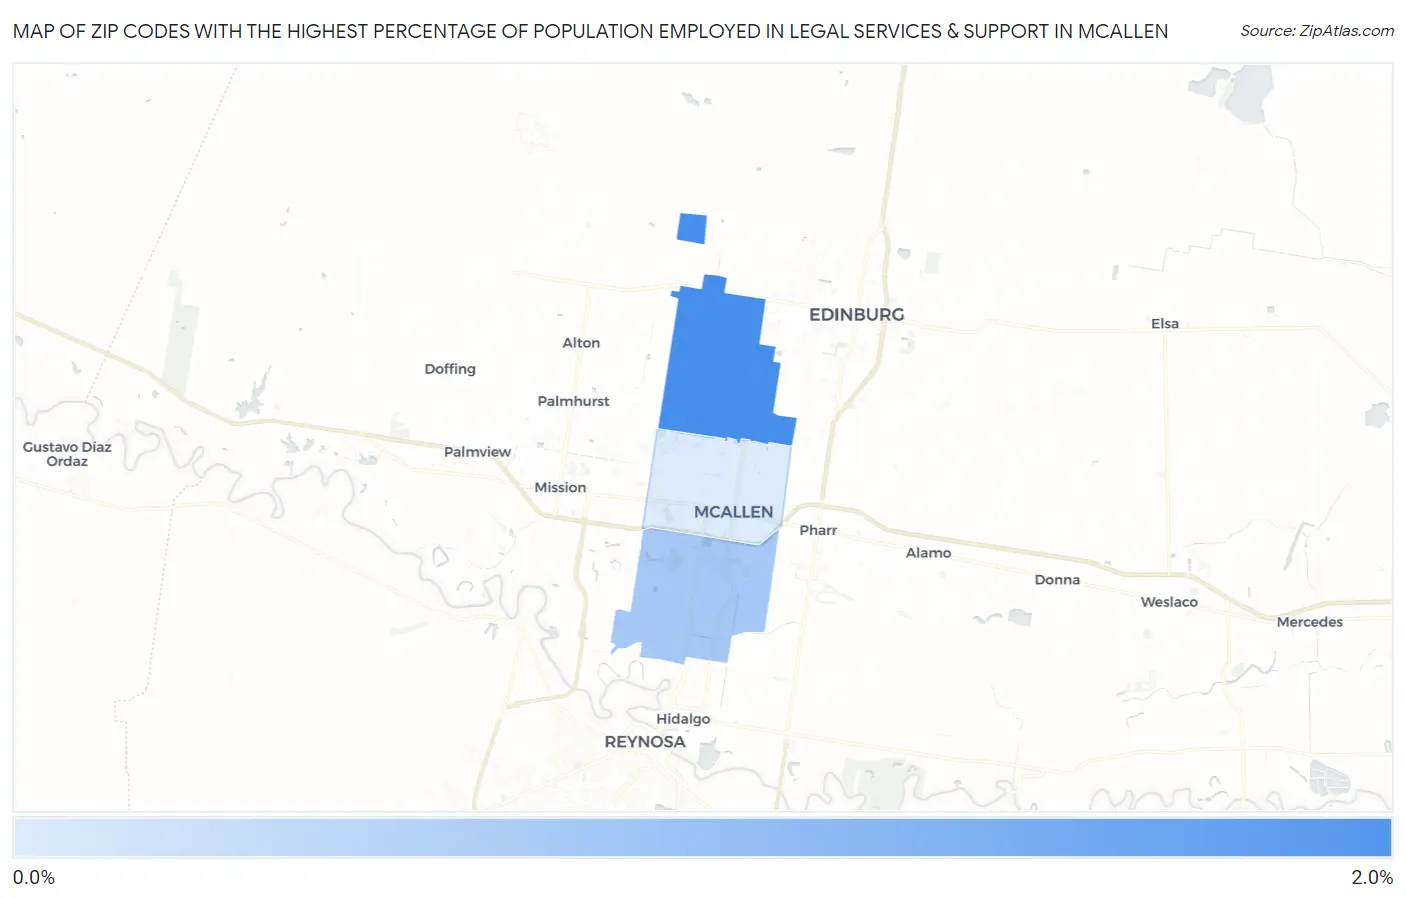
Map of Zip Codes with the Highest Percentage of Population Employed in Legal Services & Support in Mcallen
0.73%
2.0%
Zip Codes with the Highest Percentage of Population Employed in Legal Services & Support in Mcallen, TX
| Zip Code | % Employed | vs State | vs National | |
| 1. | 78504 | 2.0% | 1.0%(+0.949)#187 | 1.2%(+0.773)#3,584 |
| 2. | 78503 | 1.2% | 1.0%(+0.178)#358 | 1.2%(+0.002)#6,600 |
| 3. | 78501 | 0.73% | 1.0%(-0.279)#573 | 1.2%(-0.454)#10,111 |
1
Common Questions
What are the Top Zip Codes with the Highest Percentage of Population Employed in Legal Services & Support in Mcallen, TX?
Top Zip Codes with the Highest Percentage of Population Employed in Legal Services & Support in Mcallen, TX are:
What zip code has the Highest Percentage of Population Employed in Legal Services & Support in Mcallen, TX?
78504 has the Highest Percentage of Population Employed in Legal Services & Support in Mcallen, TX with 2.0%.
What is the Percentage of Population Employed in Legal Services & Support in Mcallen, TX?
Percentage of Population Employed in Legal Services & Support in Mcallen is 1.3%.
What is the Percentage of Population Employed in Legal Services & Support in Texas?
Percentage of Population Employed in Legal Services & Support in Texas is 1.0%.
What is the Percentage of Population Employed in Legal Services & Support in the United States?
Percentage of Population Employed in Legal Services & Support in the United States is 1.2%.