Zip Codes with the Highest Percentage of Population Employed in Legal Services & Support in Mission, TX
RELATED REPORTS & OPTIONS
Legal Services & Support
Mission
Compare Zip Codes
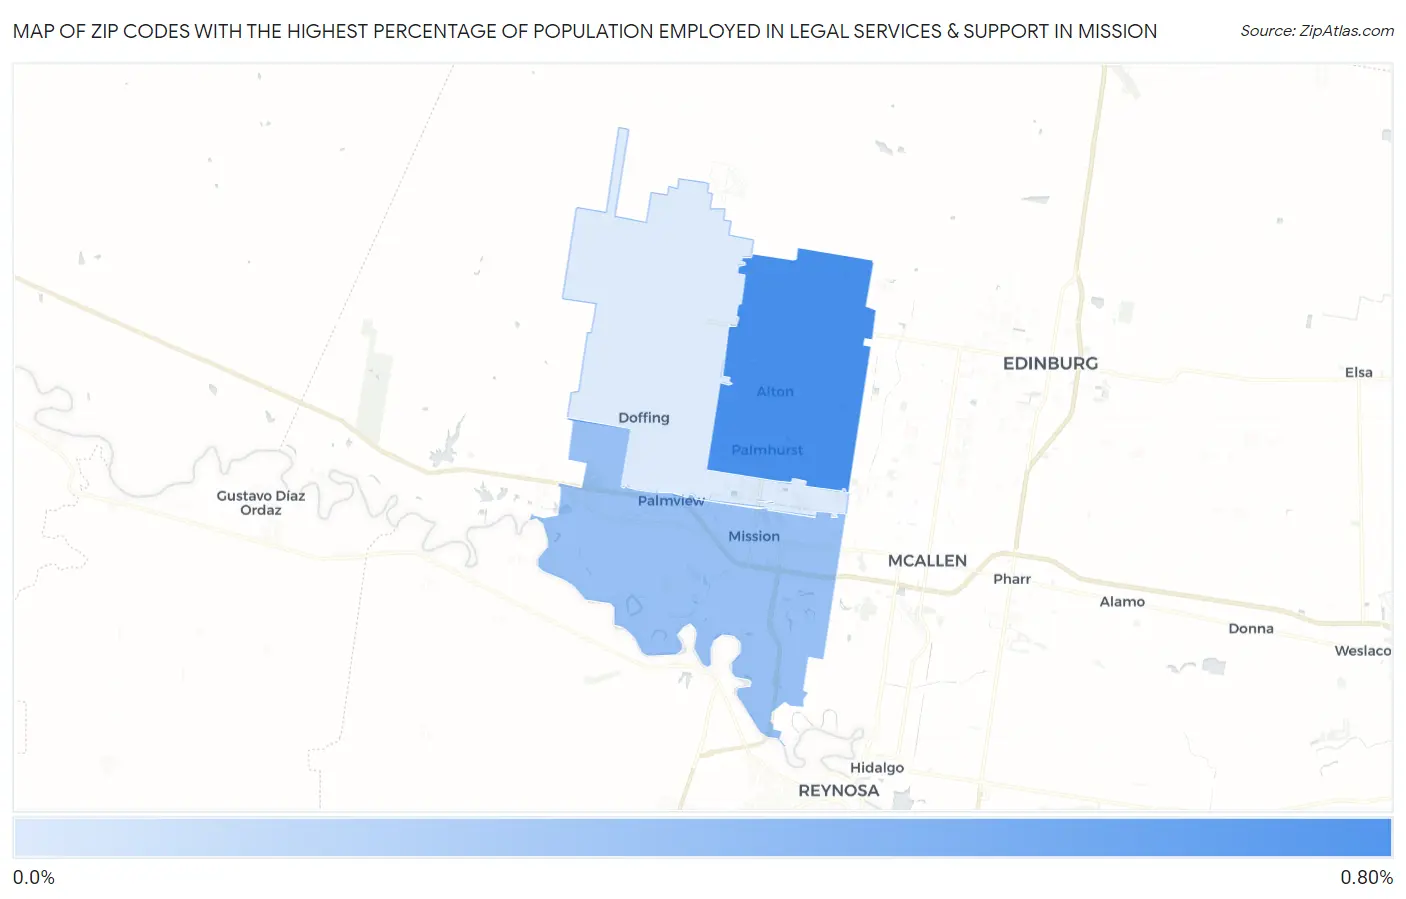
Map of Zip Codes with the Highest Percentage of Population Employed in Legal Services & Support in Mission
0.14%
0.69%
Zip Codes with the Highest Percentage of Population Employed in Legal Services & Support in Mission, TX
| Zip Code | % Employed | vs State | vs National | |
| 1. | 78573 | 0.69% | 1.0%(-0.321)#614 | 1.2%(-0.497)#10,536 |
| 2. | 78572 | 0.39% | 1.0%(-0.617)#849 | 1.2%(-0.793)#13,934 |
| 3. | 78574 | 0.14% | 1.0%(-0.864)#1,034 | 1.2%(-1.04)#16,748 |
1
Common Questions
What are the Top Zip Codes with the Highest Percentage of Population Employed in Legal Services & Support in Mission, TX?
Top Zip Codes with the Highest Percentage of Population Employed in Legal Services & Support in Mission, TX are:
What zip code has the Highest Percentage of Population Employed in Legal Services & Support in Mission, TX?
78573 has the Highest Percentage of Population Employed in Legal Services & Support in Mission, TX with 0.69%.
What is the Percentage of Population Employed in Legal Services & Support in Mission, TX?
Percentage of Population Employed in Legal Services & Support in Mission is 0.49%.
What is the Percentage of Population Employed in Legal Services & Support in Texas?
Percentage of Population Employed in Legal Services & Support in Texas is 1.0%.
What is the Percentage of Population Employed in Legal Services & Support in the United States?
Percentage of Population Employed in Legal Services & Support in the United States is 1.2%.