Zip Codes with the Highest Percentage of Households Without a Vehicle in Cleveland, OH
RELATED REPORTS & OPTIONS
Households without a Cars
Cleveland
Compare Zip Codes
Map of Zip Codes with the Highest Percentage of Households Without a Vehicle in Cleveland
4.5%
46.4%
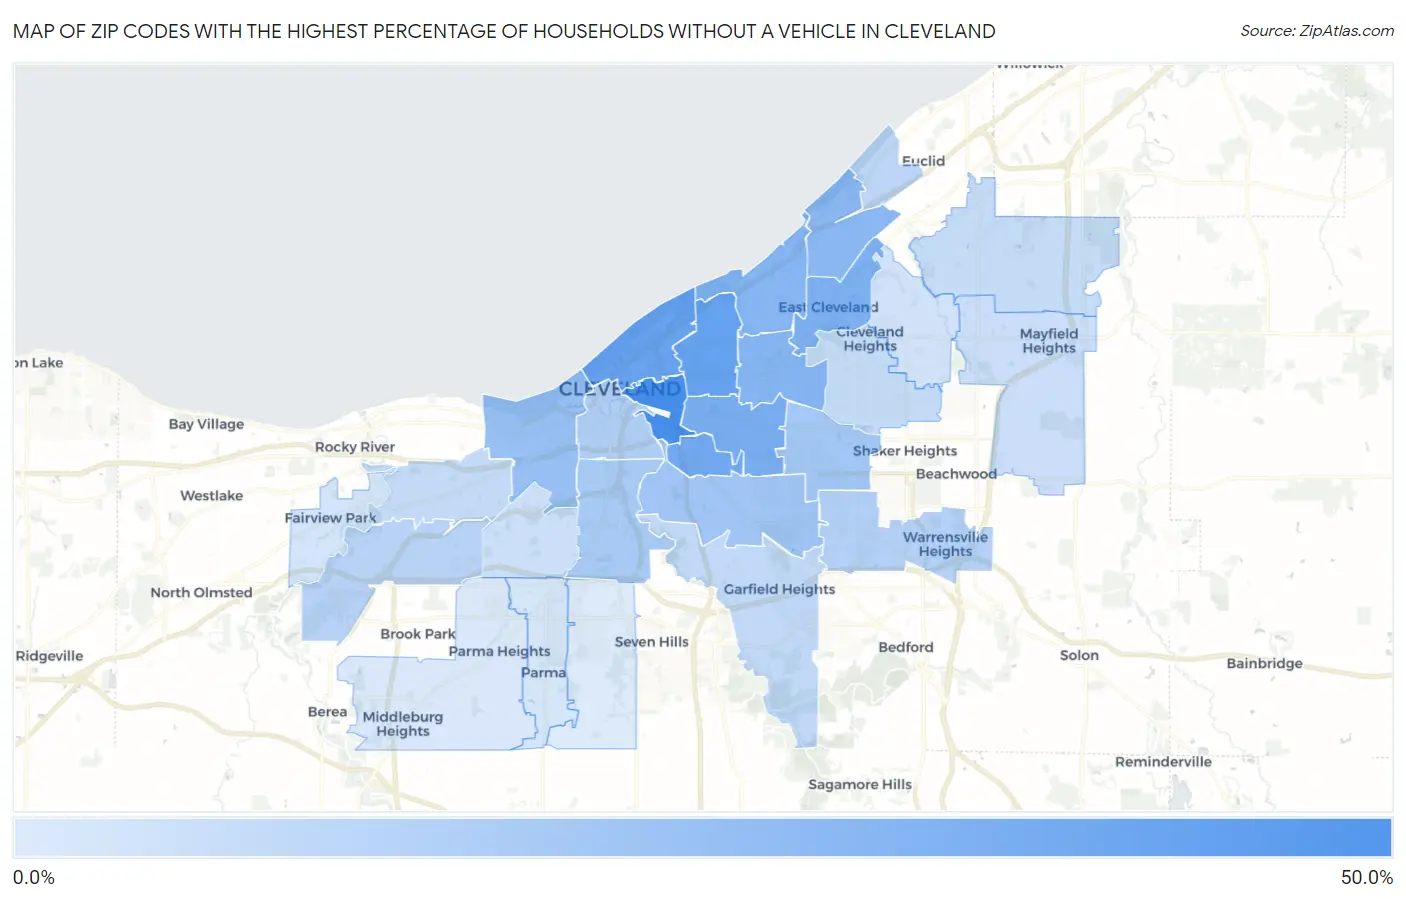
Zip Codes with the Highest Percentage of Households Without a Vehicle in Cleveland, OH
| Zip Code | Housholds Without a Car | vs State | vs National | |
| 1. | 44115 | 46.4% | 7.4% (+39.0)#6 | 8.3% (+38.1)#387 |
| 2. | 44103 | 36.9% | 7.4% (+29.5)#17 | 8.3% (+28.6)#595 |
| 3. | 44114 | 35.9% | 7.4% (+28.5)#20 | 8.3% (+27.6)#617 |
| 4. | 44127 | 33.4% | 7.4% (+26.0)#23 | 8.3% (+25.1)#676 |
| 5. | 44104 | 31.4% | 7.4% (+24.0)#30 | 8.3% (+23.1)#752 |
| 6. | 44112 | 30.2% | 7.4% (+22.8)#35 | 8.3% (+21.9)#787 |
| 7. | 44106 | 27.6% | 7.4% (+20.2)#41 | 8.3% (+19.3)#906 |
| 8. | 44108 | 27.4% | 7.4% (+20.0)#42 | 8.3% (+19.1)#917 |
| 9. | 44110 | 25.9% | 7.4% (+18.5)#46 | 8.3% (+17.6)#1,008 |
| 10. | 44102 | 22.2% | 7.4% (+14.8)#55 | 8.3% (+13.9)#1,280 |
| 11. | 44105 | 19.6% | 7.4% (+12.2)#65 | 8.3% (+11.3)#1,551 |
| 12. | 44120 | 19.1% | 7.4% (+11.7)#72 | 8.3% (+10.8)#1,612 |
| 13. | 44109 | 17.9% | 7.4% (+10.5)#77 | 8.3% (+9.60)#1,793 |
| 14. | 44113 | 16.1% | 7.4% (+8.70)#100 | 8.3% (+7.80)#2,127 |
| 15. | 44128 | 14.8% | 7.4% (+7.40)#115 | 8.3% (+6.50)#2,442 |
| 16. | 44135 | 13.3% | 7.4% (+5.90)#139 | 8.3% (+5.00)#2,964 |
| 17. | 44119 | 12.6% | 7.4% (+5.20)#157 | 8.3% (+4.30)#3,283 |
| 18. | 44125 | 11.0% | 7.4% (+3.60)#184 | 8.3% (+2.70)#4,130 |
| 19. | 44111 | 10.4% | 7.4% (+3.00)#201 | 8.3% (+2.10)#4,520 |
| 20. | 44143 | 10.0% | 7.4% (+2.60)#214 | 8.3% (+1.70)#4,857 |
| 21. | 44118 | 9.9% | 7.4% (+2.50)#220 | 8.3% (+1.60)#4,931 |
| 22. | 44124 | 8.9% | 7.4% (+1.50)#252 | 8.3% (+0.600)#5,829 |
| 23. | 44144 | 8.2% | 7.4% (+0.800)#284 | 8.3% (-0.100)#6,665 |
| 24. | 44121 | 7.4% | 7.4% (=0.000)#318 | 8.3% (-0.900)#7,859 |
| 25. | 44126 | 6.8% | 7.4% (-0.600)#364 | 8.3% (-1.50)#8,884 |
| 26. | 44129 | 6.2% | 7.4% (-1.20)#398 | 8.3% (-2.10)#10,002 |
| 27. | 44130 | 5.3% | 7.4% (-2.10)#468 | 8.3% (-3.00)#12,058 |
| 28. | 44134 | 4.5% | 7.4% (-2.90)#554 | 8.3% (-3.80)#14,182 |
1
Common Questions
What are the Top 10 Zip Codes with the Highest Percentage of Households Without a Vehicle in Cleveland, OH?
Top 10 Zip Codes with the Highest Percentage of Households Without a Vehicle in Cleveland, OH are:
What zip code has the Highest Percentage of Households Without a Vehicle in Cleveland, OH?
44115 has the Highest Percentage of Households Without a Vehicle in Cleveland, OH with 46.4%.
What is the Percentage of Households Without a Vehicle in Cleveland, OH?
Percentage of Households Without a Vehicle in Cleveland is 21.9%.
What is the Percentage of Households Without a Vehicle in Ohio?
Percentage of Households Without a Vehicle in Ohio is 7.4%.
What is the Percentage of Households Without a Vehicle in the United States?
Percentage of Households Without a Vehicle in the United States is 8.3%.