Zip Codes with the Highest Percentage of Population with a Degree in Visual and Performing Arts in Cleveland, OH
RELATED REPORTS & OPTIONS
Visual and Performing Arts
Cleveland
Compare Zip Codes
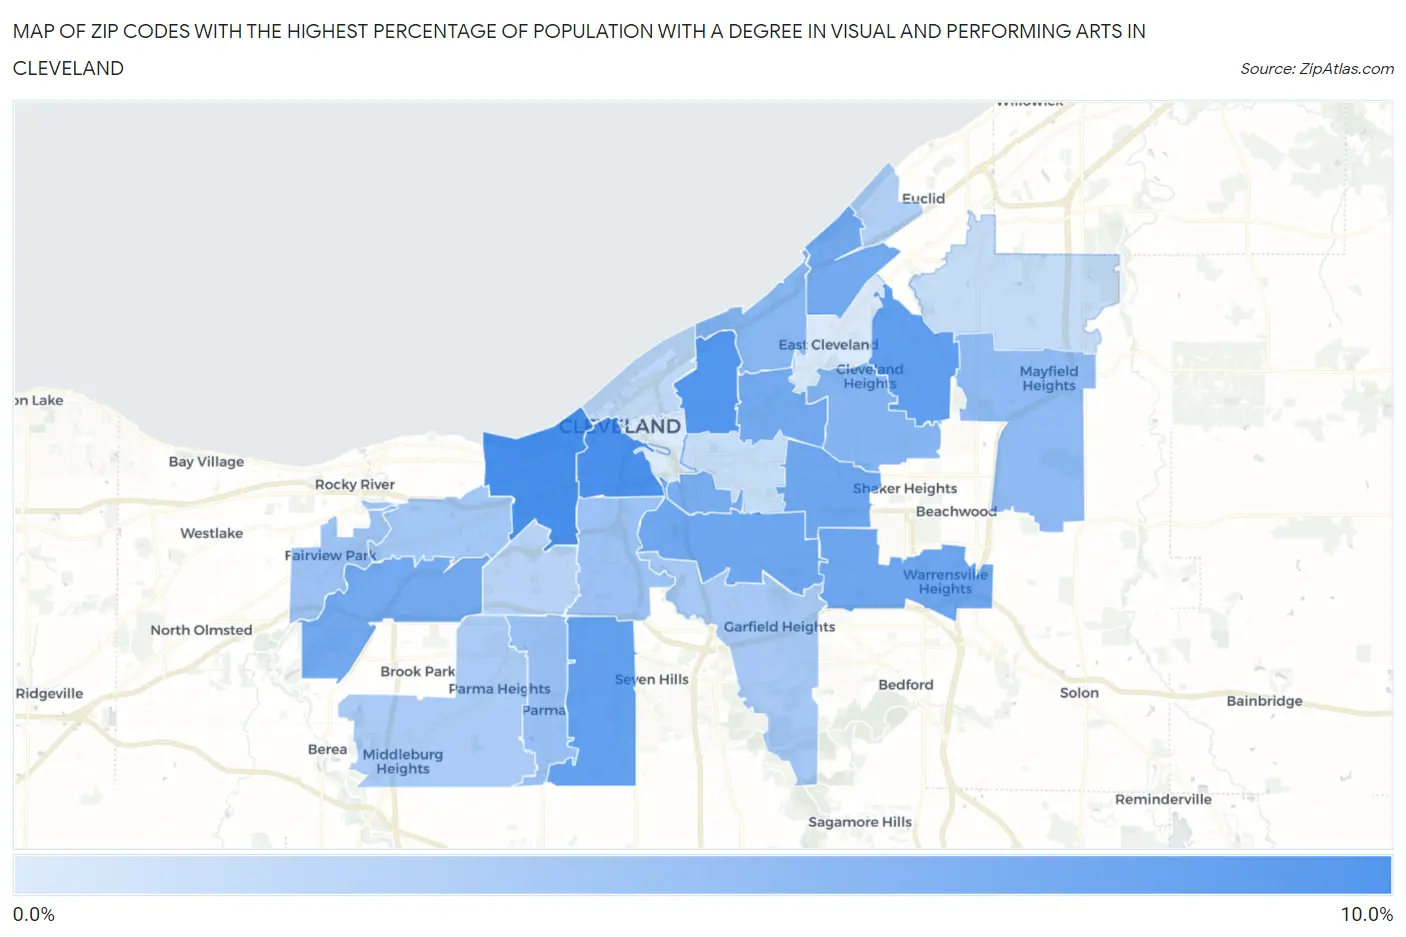
Map of Zip Codes with the Highest Percentage of Population with a Degree in Visual and Performing Arts in Cleveland
1.3%
8.5%
Zip Codes with the Highest Percentage of Population with a Degree in Visual and Performing Arts in Cleveland, OH
| Zip Code | % Graduates | vs State | vs National | |
| 1. | 44102 | 8.5% | 3.7%(+4.79)#102 | 4.3%(+4.24)#2,529 |
| 2. | 44113 | 8.4% | 3.7%(+4.72)#104 | 4.3%(+4.18)#2,575 |
| 3. | 44103 | 7.9% | 3.7%(+4.20)#113 | 4.3%(+3.66)#2,922 |
| 4. | 44121 | 7.3% | 3.7%(+3.57)#122 | 4.3%(+3.03)#3,385 |
| 5. | 44134 | 7.1% | 3.7%(+3.38)#128 | 4.3%(+2.84)#3,567 |
| 6. | 44120 | 6.6% | 3.7%(+2.91)#148 | 4.3%(+2.36)#4,103 |
| 7. | 44105 | 6.6% | 3.7%(+2.89)#149 | 4.3%(+2.34)#4,122 |
| 8. | 44128 | 6.6% | 3.7%(+2.88)#150 | 4.3%(+2.33)#4,132 |
| 9. | 44135 | 6.3% | 3.7%(+2.61)#160 | 4.3%(+2.07)#4,447 |
| 10. | 44110 | 6.3% | 3.7%(+2.60)#161 | 4.3%(+2.06)#4,462 |
| 11. | 44106 | 6.3% | 3.7%(+2.58)#162 | 4.3%(+2.04)#4,478 |
| 12. | 44127 | 6.2% | 3.7%(+2.44)#165 | 4.3%(+1.90)#4,662 |
| 13. | 44118 | 5.5% | 3.7%(+1.77)#204 | 4.3%(+1.23)#5,715 |
| 14. | 44108 | 5.3% | 3.7%(+1.57)#214 | 4.3%(+1.03)#6,089 |
| 15. | 44124 | 5.0% | 3.7%(+1.29)#234 | 4.3%(+0.753)#6,619 |
| 16. | 44129 | 4.5% | 3.7%(+0.804)#276 | 4.3%(+0.263)#7,770 |
| 17. | 44126 | 4.5% | 3.7%(+0.772)#282 | 4.3%(+0.231)#7,854 |
| 18. | 44109 | 4.3% | 3.7%(+0.630)#298 | 4.3%(+0.088)#8,238 |
| 19. | 44111 | 4.1% | 3.7%(+0.342)#320 | 4.3%(-0.199)#9,076 |
| 20. | 44125 | 3.9% | 3.7%(+0.150)#345 | 4.3%(-0.391)#9,698 |
| 21. | 44130 | 3.7% | 3.7%(-0.054)#369 | 4.3%(-0.595)#10,316 |
| 22. | 44119 | 3.4% | 3.7%(-0.358)#414 | 4.3%(-0.900)#11,410 |
| 23. | 44144 | 3.0% | 3.7%(-0.680)#448 | 4.3%(-1.22)#12,624 |
| 24. | 44114 | 2.7% | 3.7%(-1.05)#503 | 4.3%(-1.59)#14,042 |
| 25. | 44143 | 2.4% | 3.7%(-1.36)#544 | 4.3%(-1.90)#15,161 |
| 26. | 44104 | 2.4% | 3.7%(-1.36)#545 | 4.3%(-1.90)#15,165 |
| 27. | 44112 | 1.4% | 3.7%(-2.33)#676 | 4.3%(-2.87)#18,531 |
| 28. | 44115 | 1.3% | 3.7%(-2.42)#691 | 4.3%(-2.96)#18,804 |
1
Common Questions
What are the Top 10 Zip Codes with the Highest Percentage of Population with a Degree in Visual and Performing Arts in Cleveland, OH?
Top 10 Zip Codes with the Highest Percentage of Population with a Degree in Visual and Performing Arts in Cleveland, OH are:
What zip code has the Highest Percentage of Population with a Degree in Visual and Performing Arts in Cleveland, OH?
44102 has the Highest Percentage of Population with a Degree in Visual and Performing Arts in Cleveland, OH with 8.5%.
What is the Percentage of Population with a Degree in Visual and Performing Arts in Cleveland, OH?
Percentage of Population with a Degree in Visual and Performing Arts in Cleveland is 5.6%.
What is the Percentage of Population with a Degree in Visual and Performing Arts in Ohio?
Percentage of Population with a Degree in Visual and Performing Arts in Ohio is 3.7%.
What is the Percentage of Population with a Degree in Visual and Performing Arts in the United States?
Percentage of Population with a Degree in Visual and Performing Arts in the United States is 4.3%.