Zip Codes with the Highest Percentage of Population Employed in Firefighting & Prevention in North Carolina
RELATED REPORTS & OPTIONS
Firefighting & Prevention
North Carolina
Compare Zip Codes
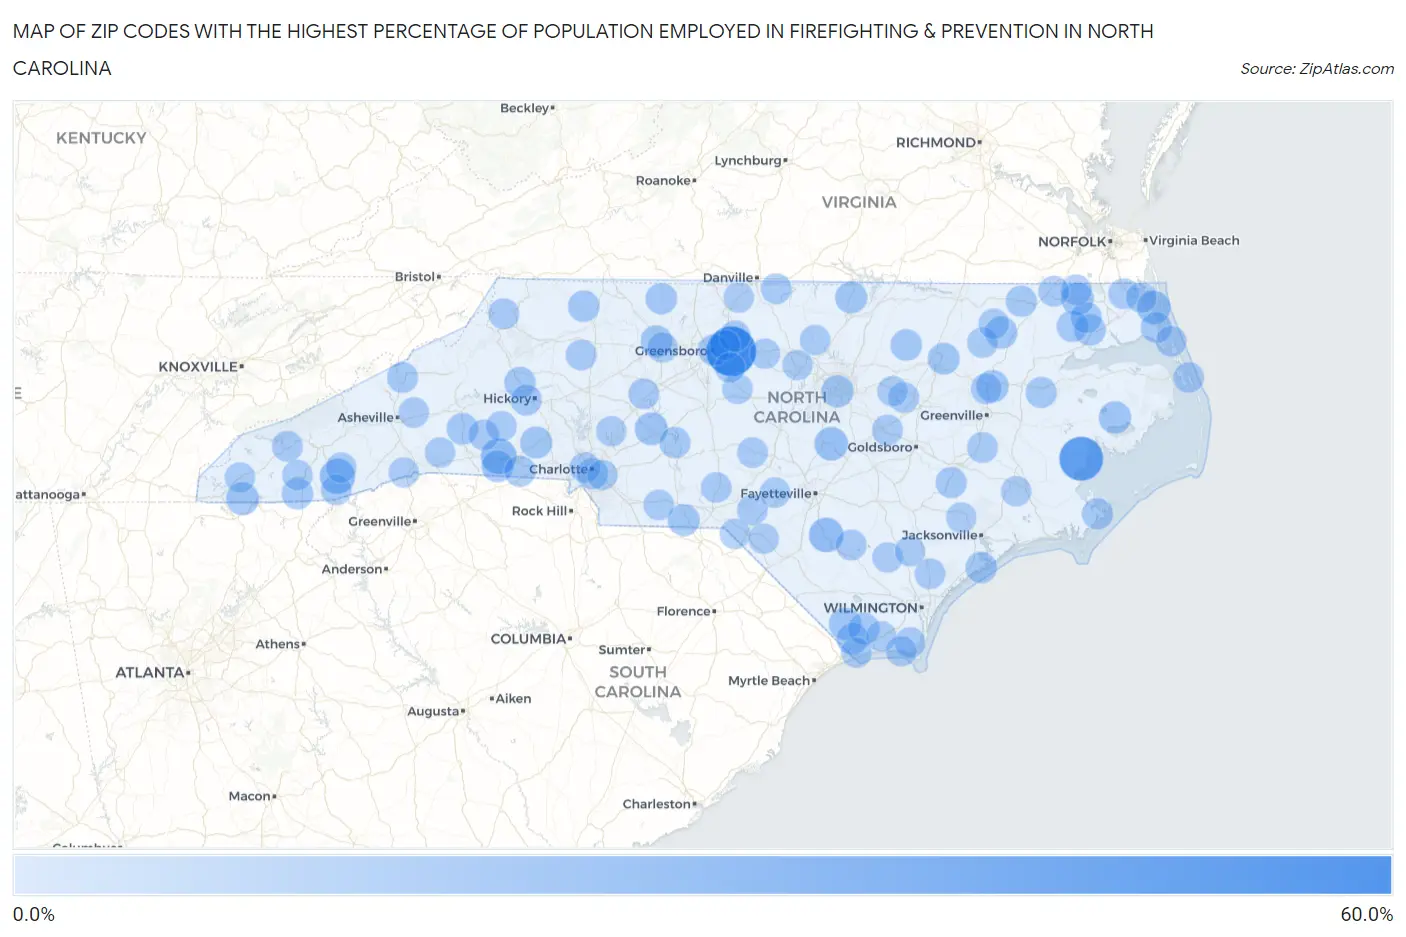
Map of Zip Codes with the Highest Percentage of Population Employed in Firefighting & Prevention in North Carolina
0.0%
60.0%
Zip Codes with the Highest Percentage of Population Employed in Firefighting & Prevention in North Carolina
| Zip Code | % Employed | vs State | vs National | |
| 1. | 27342 | 50.9% | 0.96%(+49.9)#1 | 1.2%(+49.7)#18 |
| 2. | 28552 | 35.9% | 0.96%(+34.9)#2 | 1.2%(+34.7)#34 |
| 3. | 28089 | 15.0% | 0.96%(+14.0)#3 | 1.2%(+13.8)#160 |
| 4. | 28736 | 14.0% | 0.96%(+13.1)#4 | 1.2%(+12.8)#177 |
| 5. | 28392 | 12.4% | 0.96%(+11.4)#5 | 1.2%(+11.2)#215 |
| 6. | 27506 | 10.0% | 0.96%(+9.04)#6 | 1.2%(+8.81)#302 |
| 7. | 27923 | 9.7% | 0.96%(+8.73)#7 | 1.2%(+8.50)#316 |
| 8. | 28071 | 7.9% | 0.96%(+6.94)#8 | 1.2%(+6.71)#419 |
| 9. | 28909 | 7.9% | 0.96%(+6.92)#9 | 1.2%(+6.69)#423 |
| 10. | 27979 | 7.6% | 0.96%(+6.62)#10 | 1.2%(+6.40)#455 |
| 11. | 27695 | 7.2% | 0.96%(+6.28)#11 | 1.2%(+6.06)#481 |
| 12. | 27826 | 7.0% | 0.96%(+6.01)#12 | 1.2%(+5.79)#515 |
| 13. | 27861 | 7.0% | 0.96%(+6.01)#13 | 1.2%(+5.79)#518 |
| 14. | 28455 | 6.9% | 0.96%(+5.96)#14 | 1.2%(+5.73)#523 |
| 15. | 27872 | 6.5% | 0.96%(+5.49)#15 | 1.2%(+5.27)#599 |
| 16. | 27109 | 6.0% | 0.96%(+5.07)#16 | 1.2%(+4.85)#672 |
| 17. | 28033 | 6.0% | 0.96%(+5.06)#17 | 1.2%(+4.83)#674 |
| 18. | 27582 | 5.8% | 0.96%(+4.86)#18 | 1.2%(+4.63)#701 |
| 19. | 28119 | 5.7% | 0.96%(+4.70)#19 | 1.2%(+4.47)#736 |
| 20. | 28017 | 5.6% | 0.96%(+4.68)#20 | 1.2%(+4.46)#742 |
| 21. | 28452 | 5.4% | 0.96%(+4.39)#21 | 1.2%(+4.17)#796 |
| 22. | 27809 | 5.3% | 0.96%(+4.37)#22 | 1.2%(+4.14)#799 |
| 23. | 28167 | 5.0% | 0.96%(+4.04)#23 | 1.2%(+3.82)#908 |
| 24. | 27816 | 4.9% | 0.96%(+3.97)#24 | 1.2%(+3.75)#935 |
| 25. | 27985 | 4.9% | 0.96%(+3.96)#25 | 1.2%(+3.73)#941 |
| 26. | 28420 | 4.9% | 0.96%(+3.94)#26 | 1.2%(+3.71)#949 |
| 27. | 28460 | 4.9% | 0.96%(+3.90)#27 | 1.2%(+3.67)#964 |
| 28. | 27980 | 4.7% | 0.96%(+3.79)#28 | 1.2%(+3.56)#1,006 |
| 29. | 28683 | 4.7% | 0.96%(+3.69)#29 | 1.2%(+3.47)#1,042 |
| 30. | 27016 | 4.5% | 0.96%(+3.56)#30 | 1.2%(+3.33)#1,095 |
| 31. | 28638 | 4.5% | 0.96%(+3.50)#31 | 1.2%(+3.27)#1,122 |
| 32. | 28763 | 4.4% | 0.96%(+3.41)#32 | 1.2%(+3.19)#1,164 |
| 33. | 27411 | 4.3% | 0.96%(+3.37)#33 | 1.2%(+3.14)#1,191 |
| 34. | 28577 | 4.3% | 0.96%(+3.29)#34 | 1.2%(+3.07)#1,221 |
| 35. | 28274 | 3.9% | 0.96%(+2.96)#35 | 1.2%(+2.74)#1,401 |
| 36. | 27919 | 3.9% | 0.96%(+2.89)#36 | 1.2%(+2.67)#1,440 |
| 37. | 28073 | 3.8% | 0.96%(+2.85)#37 | 1.2%(+2.63)#1,464 |
| 38. | 27939 | 3.8% | 0.96%(+2.83)#38 | 1.2%(+2.60)#1,477 |
| 39. | 28525 | 3.7% | 0.96%(+2.70)#39 | 1.2%(+2.48)#1,588 |
| 40. | 27846 | 3.7% | 0.96%(+2.70)#40 | 1.2%(+2.47)#1,590 |
| 41. | 27855 | 3.6% | 0.96%(+2.65)#41 | 1.2%(+2.43)#1,625 |
| 42. | 28009 | 3.6% | 0.96%(+2.59)#42 | 1.2%(+2.37)#1,679 |
| 43. | 27249 | 3.5% | 0.96%(+2.55)#43 | 1.2%(+2.32)#1,717 |
| 44. | 28754 | 3.4% | 0.96%(+2.48)#44 | 1.2%(+2.26)#1,774 |
| 45. | 28637 | 3.4% | 0.96%(+2.41)#45 | 1.2%(+2.19)#1,838 |
| 46. | 28689 | 3.2% | 0.96%(+2.26)#46 | 1.2%(+2.04)#1,995 |
| 47. | 28713 | 3.2% | 0.96%(+2.26)#47 | 1.2%(+2.04)#1,996 |
| 48. | 28337 | 3.2% | 0.96%(+2.19)#48 | 1.2%(+1.97)#2,079 |
| 49. | 27812 | 3.1% | 0.96%(+2.13)#49 | 1.2%(+1.91)#2,137 |
| 50. | 28530 | 3.0% | 0.96%(+2.04)#50 | 1.2%(+1.82)#2,238 |
| 51. | 28684 | 3.0% | 0.96%(+2.04)#51 | 1.2%(+1.82)#2,243 |
| 52. | 27568 | 2.9% | 0.96%(+1.99)#52 | 1.2%(+1.76)#2,318 |
| 53. | 27958 | 2.9% | 0.96%(+1.98)#53 | 1.2%(+1.76)#2,321 |
| 54. | 27926 | 2.9% | 0.96%(+1.94)#54 | 1.2%(+1.72)#2,367 |
| 55. | 27937 | 2.9% | 0.96%(+1.94)#55 | 1.2%(+1.72)#2,372 |
| 56. | 27299 | 2.9% | 0.96%(+1.93)#56 | 1.2%(+1.70)#2,402 |
| 57. | 28208 | 2.9% | 0.96%(+1.91)#57 | 1.2%(+1.69)#2,431 |
| 58. | 27929 | 2.9% | 0.96%(+1.90)#58 | 1.2%(+1.68)#2,442 |
| 59. | 27874 | 2.8% | 0.96%(+1.87)#59 | 1.2%(+1.65)#2,504 |
| 60. | 28018 | 2.8% | 0.96%(+1.80)#60 | 1.2%(+1.58)#2,619 |
| 61. | 28338 | 2.7% | 0.96%(+1.78)#61 | 1.2%(+1.56)#2,658 |
| 62. | 27880 | 2.7% | 0.96%(+1.77)#62 | 1.2%(+1.55)#2,677 |
| 63. | 27949 | 2.7% | 0.96%(+1.74)#63 | 1.2%(+1.52)#2,718 |
| 64. | 27959 | 2.6% | 0.96%(+1.65)#64 | 1.2%(+1.42)#2,876 |
| 65. | 28327 | 2.6% | 0.96%(+1.63)#65 | 1.2%(+1.41)#2,906 |
| 66. | 28457 | 2.5% | 0.96%(+1.57)#66 | 1.2%(+1.35)#3,033 |
| 67. | 28020 | 2.5% | 0.96%(+1.53)#67 | 1.2%(+1.30)#3,121 |
| 68. | 28461 | 2.5% | 0.96%(+1.51)#68 | 1.2%(+1.29)#3,156 |
| 69. | 28396 | 2.5% | 0.96%(+1.51)#69 | 1.2%(+1.29)#3,160 |
| 70. | 27305 | 2.4% | 0.96%(+1.48)#70 | 1.2%(+1.26)#3,221 |
| 71. | 27355 | 2.4% | 0.96%(+1.47)#71 | 1.2%(+1.25)#3,252 |
| 72. | 28465 | 2.4% | 0.96%(+1.46)#72 | 1.2%(+1.24)#3,281 |
| 73. | 28468 | 2.4% | 0.96%(+1.45)#73 | 1.2%(+1.23)#3,298 |
| 74. | 27557 | 2.4% | 0.96%(+1.40)#74 | 1.2%(+1.17)#3,438 |
| 75. | 27110 | 2.3% | 0.96%(+1.36)#75 | 1.2%(+1.14)#3,501 |
| 76. | 28778 | 2.3% | 0.96%(+1.31)#76 | 1.2%(+1.09)#3,629 |
| 77. | 28343 | 2.2% | 0.96%(+1.25)#77 | 1.2%(+1.03)#3,808 |
| 78. | 28376 | 2.2% | 0.96%(+1.25)#78 | 1.2%(+1.03)#3,827 |
| 79. | 28081 | 2.2% | 0.96%(+1.23)#79 | 1.2%(+1.00)#3,902 |
| 80. | 27869 | 2.2% | 0.96%(+1.20)#80 | 1.2%(+0.979)#3,973 |
| 81. | 28447 | 2.2% | 0.96%(+1.20)#81 | 1.2%(+0.976)#3,984 |
| 82. | 27503 | 2.1% | 0.96%(+1.18)#82 | 1.2%(+0.960)#4,020 |
| 83. | 27326 | 2.1% | 0.96%(+1.18)#83 | 1.2%(+0.953)#4,036 |
| 84. | 28734 | 2.1% | 0.96%(+1.16)#84 | 1.2%(+0.934)#4,097 |
| 85. | 28133 | 2.1% | 0.96%(+1.15)#85 | 1.2%(+0.926)#4,125 |
| 86. | 28756 | 2.1% | 0.96%(+1.14)#86 | 1.2%(+0.913)#4,154 |
| 87. | 28562 | 2.1% | 0.96%(+1.10)#87 | 1.2%(+0.873)#4,295 |
| 88. | 28364 | 2.0% | 0.96%(+1.06)#88 | 1.2%(+0.834)#4,446 |
| 89. | 28717 | 2.0% | 0.96%(+1.05)#89 | 1.2%(+0.829)#4,459 |
| 90. | 28462 | 2.0% | 0.96%(+1.04)#90 | 1.2%(+0.813)#4,514 |
| 91. | 28905 | 2.0% | 0.96%(+1.03)#91 | 1.2%(+0.811)#4,516 |
| 92. | 27514 | 2.0% | 0.96%(+1.02)#92 | 1.2%(+0.801)#4,555 |
| 93. | 27258 | 1.9% | 0.96%(+0.987)#93 | 1.2%(+0.763)#4,703 |
| 94. | 27301 | 1.9% | 0.96%(+0.973)#94 | 1.2%(+0.749)#4,765 |
| 95. | 28212 | 1.9% | 0.96%(+0.966)#95 | 1.2%(+0.743)#4,795 |
| 96. | 28574 | 1.9% | 0.96%(+0.957)#96 | 1.2%(+0.733)#4,838 |
| 97. | 28783 | 1.9% | 0.96%(+0.954)#97 | 1.2%(+0.731)#4,850 |
| 98. | 28478 | 1.9% | 0.96%(+0.953)#98 | 1.2%(+0.730)#4,855 |
| 99. | 27283 | 1.9% | 0.96%(+0.945)#99 | 1.2%(+0.721)#4,893 |
| 100. | 28790 | 1.9% | 0.96%(+0.919)#100 | 1.2%(+0.695)#4,999 |
Common Questions
What are the Top 10 Zip Codes with the Highest Percentage of Population Employed in Firefighting & Prevention in North Carolina?
Top 10 Zip Codes with the Highest Percentage of Population Employed in Firefighting & Prevention in North Carolina are:
What zip code has the Highest Percentage of Population Employed in Firefighting & Prevention in North Carolina?
27342 has the Highest Percentage of Population Employed in Firefighting & Prevention in North Carolina with 50.9%.
What is the Percentage of Population Employed in Firefighting & Prevention in the State of North Carolina?
Percentage of Population Employed in Firefighting & Prevention in North Carolina is 0.96%.
What is the Percentage of Population Employed in Firefighting & Prevention in the United States?
Percentage of Population Employed in Firefighting & Prevention in the United States is 1.2%.