Zip Codes with the Highest Percentage of Population Employed in Security & Protection in Charlotte, NC
RELATED REPORTS & OPTIONS
Security & Protection
Charlotte
Compare Zip Codes
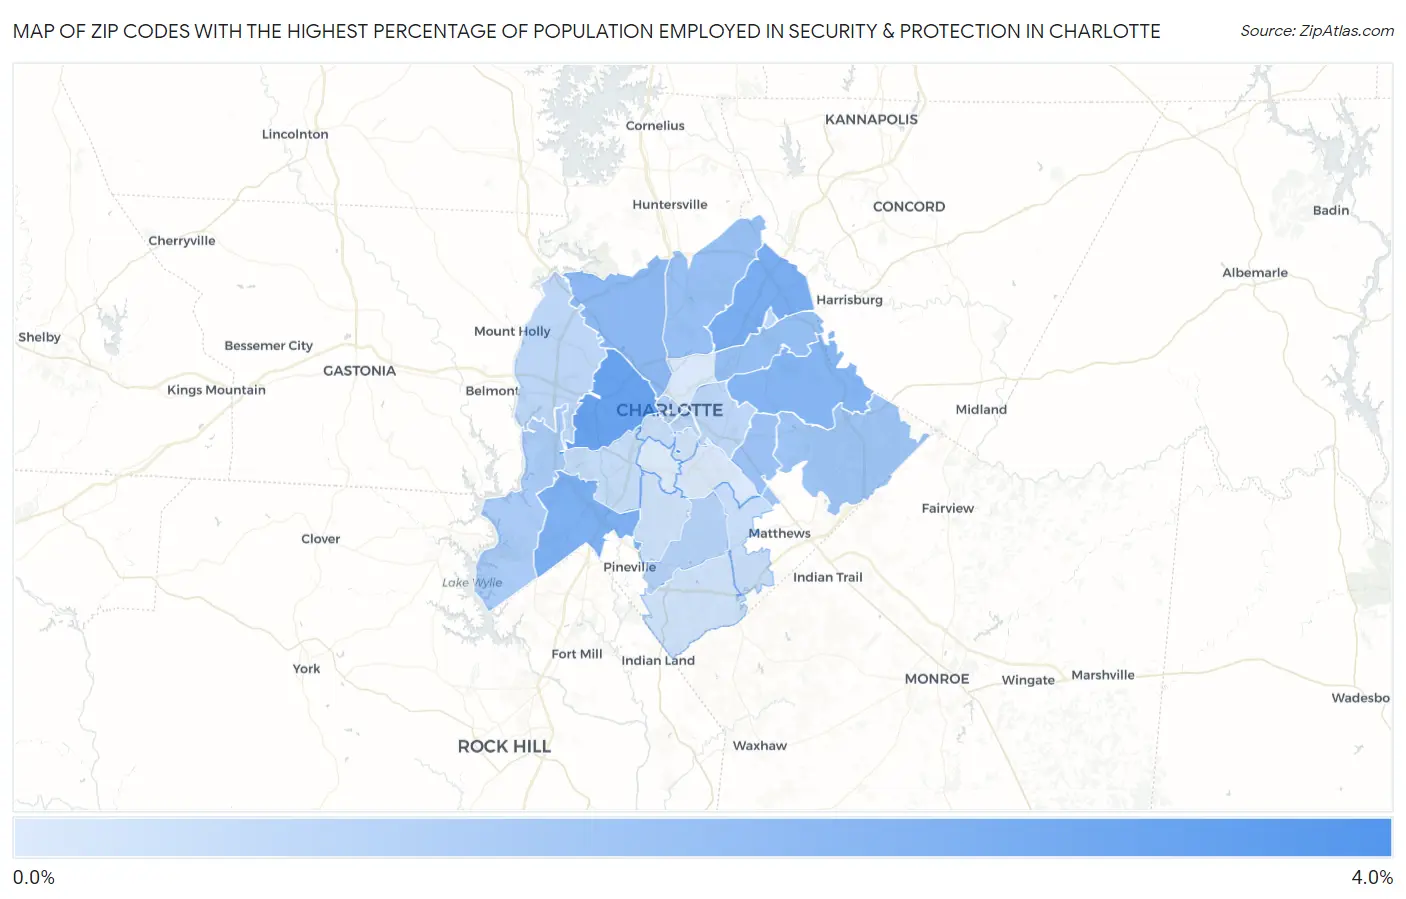
Map of Zip Codes with the Highest Percentage of Population Employed in Security & Protection in Charlotte
0.33%
3.9%
Zip Codes with the Highest Percentage of Population Employed in Security & Protection in Charlotte, NC
| Zip Code | % Employed | vs State | vs National | |
| 1. | 28274 | 3.9% | 1.9%(+2.03)#115 | 2.1%(+1.77)#4,648 |
| 2. | 28208 | 3.1% | 1.9%(+1.22)#173 | 2.1%(+0.966)#6,841 |
| 3. | 28262 | 2.7% | 1.9%(+0.815)#217 | 2.1%(+0.560)#8,495 |
| 4. | 28273 | 2.6% | 1.9%(+0.679)#235 | 2.1%(+0.424)#9,138 |
| 5. | 28215 | 2.4% | 1.9%(+0.522)#265 | 2.1%(+0.267)#9,977 |
| 6. | 28216 | 2.3% | 1.9%(+0.362)#286 | 2.1%(+0.107)#10,907 |
| 7. | 28213 | 2.0% | 1.9%(+0.121)#329 | 2.1%(-0.133)#12,460 |
| 8. | 28269 | 2.0% | 1.9%(+0.080)#338 | 2.1%(-0.175)#12,737 |
| 9. | 28212 | 1.9% | 1.9%(+0.035)#347 | 2.1%(-0.220)#13,029 |
| 10. | 28227 | 1.8% | 1.9%(-0.072)#371 | 2.1%(-0.327)#13,772 |
| 11. | 28278 | 1.5% | 1.9%(-0.371)#441 | 2.1%(-0.626)#16,009 |
| 12. | 28202 | 1.3% | 1.9%(-0.598)#500 | 2.1%(-0.853)#17,775 |
| 13. | 28226 | 1.3% | 1.9%(-0.639)#505 | 2.1%(-0.894)#18,105 |
| 14. | 28223 | 1.2% | 1.9%(-0.726)#517 | 2.1%(-0.981)#18,765 |
| 15. | 28204 | 1.1% | 1.9%(-0.759)#523 | 2.1%(-1.01)#19,033 |
| 16. | 28205 | 1.1% | 1.9%(-0.796)#531 | 2.1%(-1.05)#19,304 |
| 17. | 28214 | 1.1% | 1.9%(-0.822)#537 | 2.1%(-1.08)#19,499 |
| 18. | 28217 | 0.89% | 1.9%(-1.01)#578 | 2.1%(-1.26)#20,884 |
| 19. | 28270 | 0.84% | 1.9%(-1.06)#584 | 2.1%(-1.31)#21,187 |
| 20. | 28203 | 0.80% | 1.9%(-1.09)#590 | 2.1%(-1.35)#21,401 |
| 21. | 28210 | 0.68% | 1.9%(-1.21)#603 | 2.1%(-1.46)#22,190 |
| 22. | 28277 | 0.67% | 1.9%(-1.22)#605 | 2.1%(-1.48)#22,253 |
| 23. | 28207 | 0.60% | 1.9%(-1.30)#617 | 2.1%(-1.55)#22,676 |
| 24. | 28206 | 0.40% | 1.9%(-1.50)#641 | 2.1%(-1.75)#23,741 |
| 25. | 28211 | 0.37% | 1.9%(-1.52)#644 | 2.1%(-1.77)#23,860 |
| 26. | 28209 | 0.33% | 1.9%(-1.57)#649 | 2.1%(-1.82)#24,070 |
1
Common Questions
What are the Top 10 Zip Codes with the Highest Percentage of Population Employed in Security & Protection in Charlotte, NC?
Top 10 Zip Codes with the Highest Percentage of Population Employed in Security & Protection in Charlotte, NC are:
What zip code has the Highest Percentage of Population Employed in Security & Protection in Charlotte, NC?
28274 has the Highest Percentage of Population Employed in Security & Protection in Charlotte, NC with 3.9%.
What is the Percentage of Population Employed in Security & Protection in Charlotte, NC?
Percentage of Population Employed in Security & Protection in Charlotte is 1.5%.
What is the Percentage of Population Employed in Security & Protection in North Carolina?
Percentage of Population Employed in Security & Protection in North Carolina is 1.9%.
What is the Percentage of Population Employed in Security & Protection in the United States?
Percentage of Population Employed in Security & Protection in the United States is 2.1%.