Zip Codes with the Highest Percentage of Population Employed in Security & Protection in Henderson, NC
RELATED REPORTS & OPTIONS
Security & Protection
Henderson
Compare Zip Codes
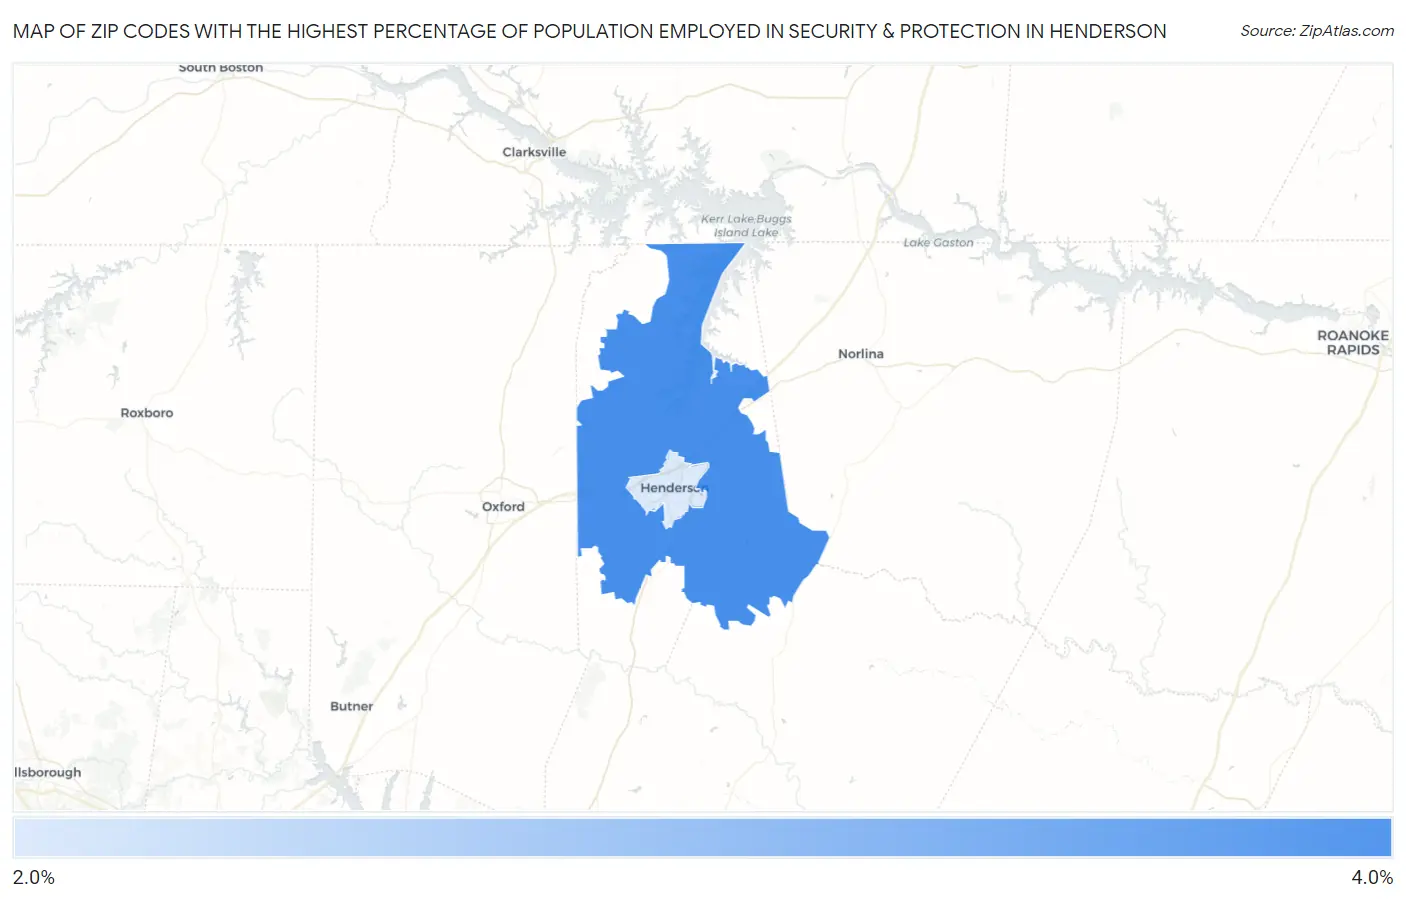
Map of Zip Codes with the Highest Percentage of Population Employed in Security & Protection in Henderson
2.5%
3.1%
Zip Codes with the Highest Percentage of Population Employed in Security & Protection in Henderson, NC
| Zip Code | % Employed | vs State | vs National | |
| 1. | 27537 | 3.1% | 1.9%(+1.23)#171 | 2.1%(+0.977)#6,792 |
| 2. | 27536 | 2.5% | 1.9%(+0.632)#244 | 2.1%(+0.377)#9,381 |
1
Common Questions
What are the Top Zip Codes with the Highest Percentage of Population Employed in Security & Protection in Henderson, NC?
Top Zip Codes with the Highest Percentage of Population Employed in Security & Protection in Henderson, NC are:
What zip code has the Highest Percentage of Population Employed in Security & Protection in Henderson, NC?
27537 has the Highest Percentage of Population Employed in Security & Protection in Henderson, NC with 3.1%.
What is the Percentage of Population Employed in Security & Protection in Henderson, NC?
Percentage of Population Employed in Security & Protection in Henderson is 2.3%.
What is the Percentage of Population Employed in Security & Protection in North Carolina?
Percentage of Population Employed in Security & Protection in North Carolina is 1.9%.
What is the Percentage of Population Employed in Security & Protection in the United States?
Percentage of Population Employed in Security & Protection in the United States is 2.1%.