Zip Codes with the Highest Percentage of Population Employed in Security & Protection in Hendersonville, NC
RELATED REPORTS & OPTIONS
Security & Protection
Hendersonville
Compare Zip Codes
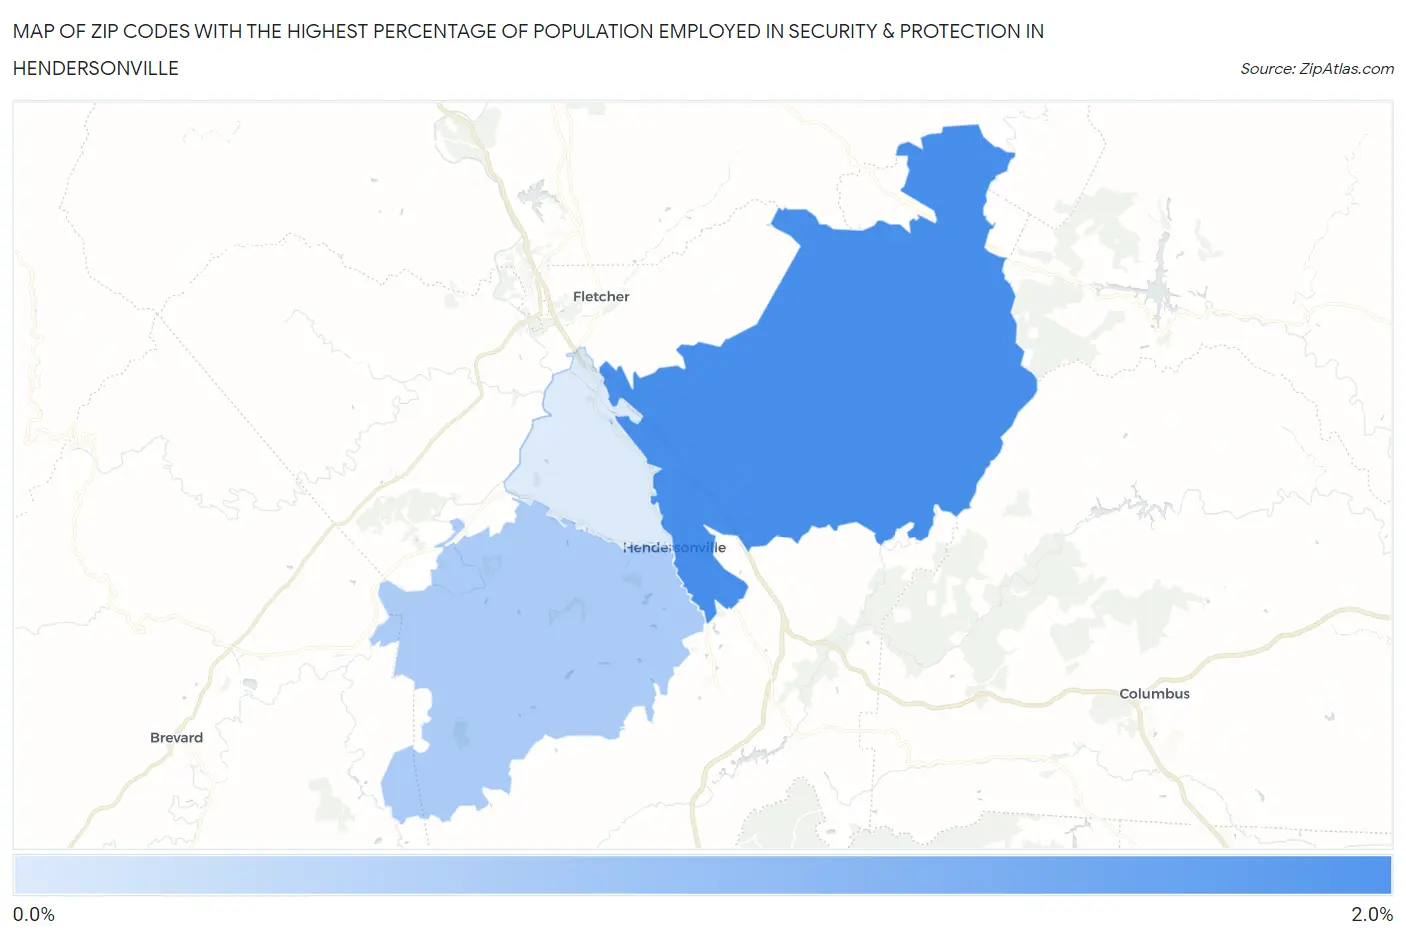
Map of Zip Codes with the Highest Percentage of Population Employed in Security & Protection in Hendersonville
1.00%
1.5%
Zip Codes with the Highest Percentage of Population Employed in Security & Protection in Hendersonville, NC
| Zip Code | % Employed | vs State | vs National | |
| 1. | 28792 | 1.5% | 1.9%(-0.390)#444 | 2.1%(-0.645)#16,167 |
| 2. | 28739 | 1.2% | 1.9%(-0.727)#518 | 2.1%(-0.982)#18,772 |
| 3. | 28791 | 1.00% | 1.9%(-0.899)#555 | 2.1%(-1.15)#20,075 |
1
Common Questions
What are the Top Zip Codes with the Highest Percentage of Population Employed in Security & Protection in Hendersonville, NC?
Top Zip Codes with the Highest Percentage of Population Employed in Security & Protection in Hendersonville, NC are:
What zip code has the Highest Percentage of Population Employed in Security & Protection in Hendersonville, NC?
28792 has the Highest Percentage of Population Employed in Security & Protection in Hendersonville, NC with 1.5%.
What is the Percentage of Population Employed in Security & Protection in Hendersonville, NC?
Percentage of Population Employed in Security & Protection in Hendersonville is 1.7%.
What is the Percentage of Population Employed in Security & Protection in North Carolina?
Percentage of Population Employed in Security & Protection in North Carolina is 1.9%.
What is the Percentage of Population Employed in Security & Protection in the United States?
Percentage of Population Employed in Security & Protection in the United States is 2.1%.