Zip Codes with the Highest Percentage of Population Employed in Security & Protection in High Point, NC
RELATED REPORTS & OPTIONS
Security & Protection
High Point
Compare Zip Codes
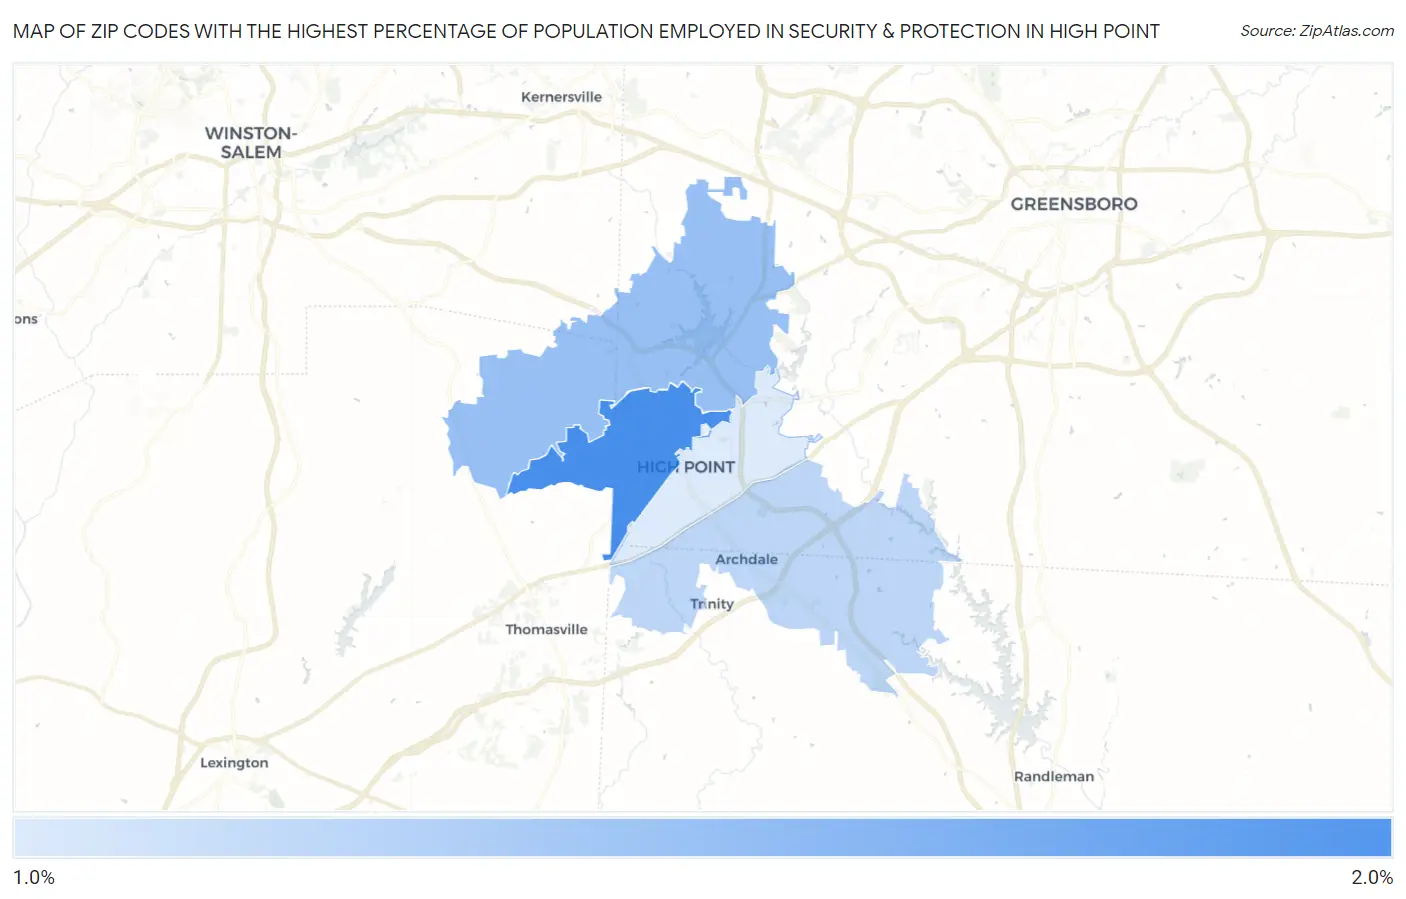
Map of Zip Codes with the Highest Percentage of Population Employed in Security & Protection in High Point
1.5%
1.8%
Zip Codes with the Highest Percentage of Population Employed in Security & Protection in High Point, NC
| Zip Code | % Employed | vs State | vs National | |
| 1. | 27262 | 1.8% | 1.9%(-0.093)#377 | 2.1%(-0.348)#13,946 |
| 2. | 27265 | 1.6% | 1.9%(-0.246)#416 | 2.1%(-0.500)#15,051 |
| 3. | 27263 | 1.6% | 1.9%(-0.314)#434 | 2.1%(-0.568)#15,565 |
| 4. | 27260 | 1.5% | 1.9%(-0.372)#443 | 2.1%(-0.627)#16,026 |
1
Common Questions
What are the Top 3 Zip Codes with the Highest Percentage of Population Employed in Security & Protection in High Point, NC?
Top 3 Zip Codes with the Highest Percentage of Population Employed in Security & Protection in High Point, NC are:
What zip code has the Highest Percentage of Population Employed in Security & Protection in High Point, NC?
27262 has the Highest Percentage of Population Employed in Security & Protection in High Point, NC with 1.8%.
What is the Percentage of Population Employed in Security & Protection in High Point, NC?
Percentage of Population Employed in Security & Protection in High Point is 1.6%.
What is the Percentage of Population Employed in Security & Protection in North Carolina?
Percentage of Population Employed in Security & Protection in North Carolina is 1.9%.
What is the Percentage of Population Employed in Security & Protection in the United States?
Percentage of Population Employed in Security & Protection in the United States is 2.1%.