Zip Codes with the Highest Percentage of Population Employed in Security & Protection in Lumberton, NC
RELATED REPORTS & OPTIONS
Security & Protection
Lumberton
Compare Zip Codes
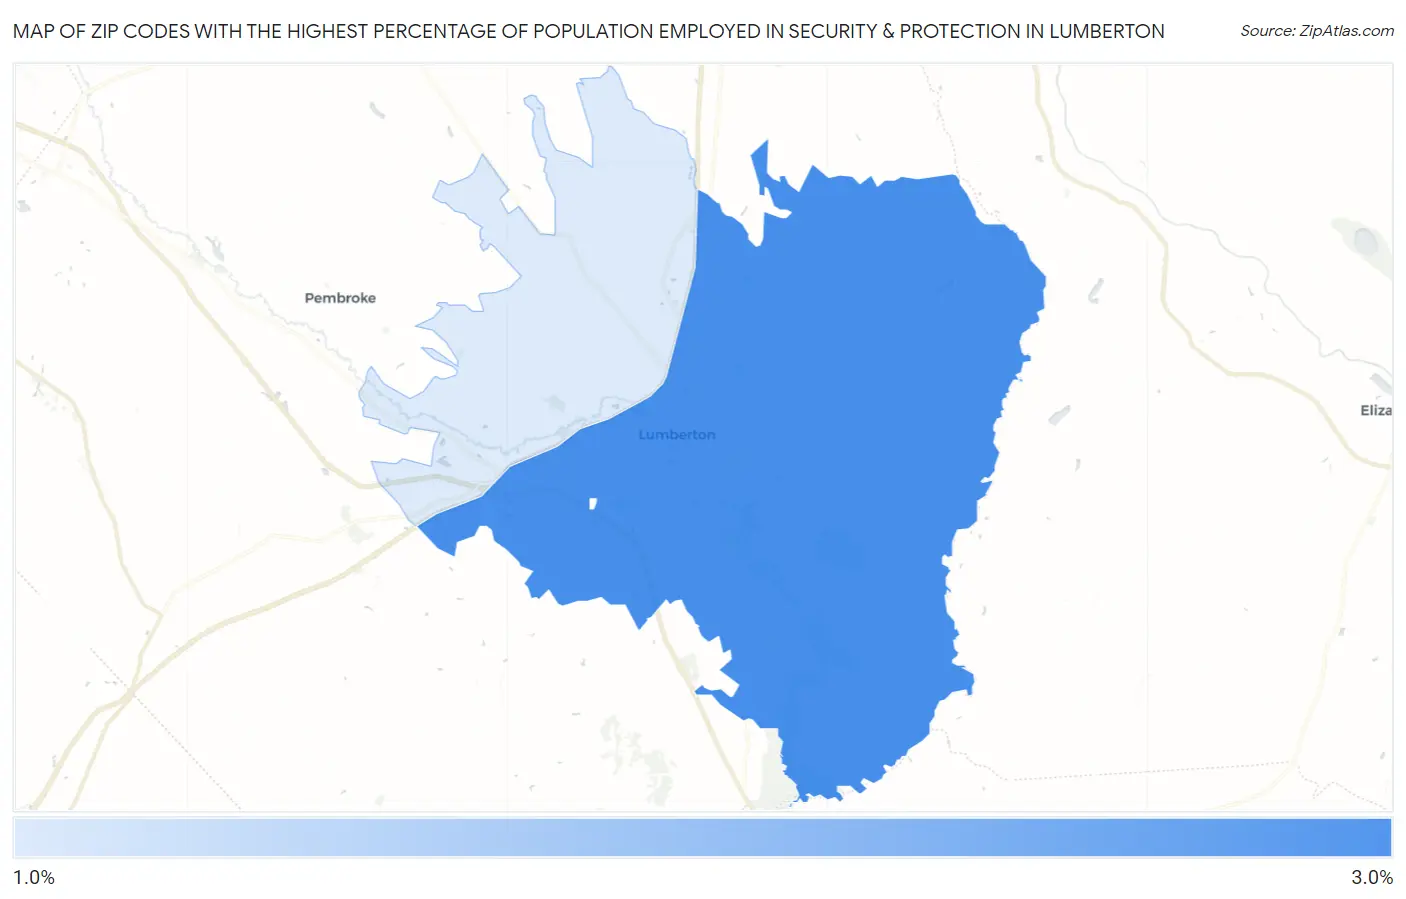
Map of Zip Codes with the Highest Percentage of Population Employed in Security & Protection in Lumberton
1.8%
2.7%
Zip Codes with the Highest Percentage of Population Employed in Security & Protection in Lumberton, NC
| Zip Code | % Employed | vs State | vs National | |
| 1. | 28358 | 2.7% | 1.9%(+0.853)#208 | 2.1%(+0.598)#8,325 |
| 2. | 28360 | 1.8% | 1.9%(-0.055)#363 | 2.1%(-0.310)#13,655 |
1
Common Questions
What are the Top Zip Codes with the Highest Percentage of Population Employed in Security & Protection in Lumberton, NC?
Top Zip Codes with the Highest Percentage of Population Employed in Security & Protection in Lumberton, NC are:
What zip code has the Highest Percentage of Population Employed in Security & Protection in Lumberton, NC?
28358 has the Highest Percentage of Population Employed in Security & Protection in Lumberton, NC with 2.7%.
What is the Percentage of Population Employed in Security & Protection in Lumberton, NC?
Percentage of Population Employed in Security & Protection in Lumberton is 2.4%.
What is the Percentage of Population Employed in Security & Protection in North Carolina?
Percentage of Population Employed in Security & Protection in North Carolina is 1.9%.
What is the Percentage of Population Employed in Security & Protection in the United States?
Percentage of Population Employed in Security & Protection in the United States is 2.1%.