Zip Codes with the Highest Percentage of Households with Income Above $200,000 in North Carolina
RELATED REPORTS & OPTIONS
Household Income | $200k+
North Carolina
Compare Zip Codes
Map of Zip Codes with the Highest Percentage of Households with Income Above $200,000 in North Carolina
0.0%
60.0%
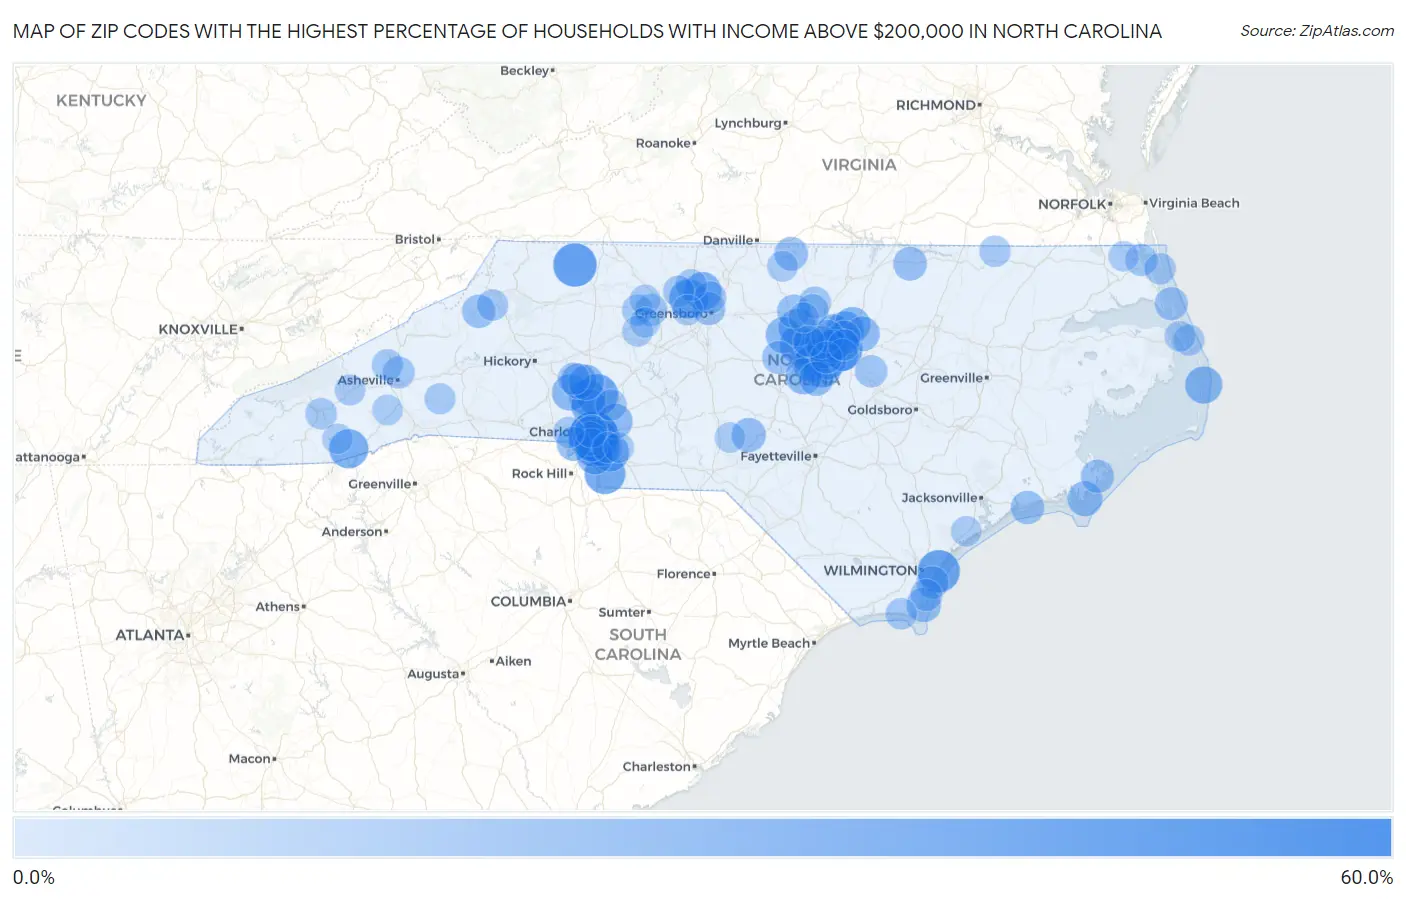
Zip Codes with the Highest Percentage of Households with Income Above $200,000 in North Carolina
| Zip Code | Households with Income > $200k | vs State | vs National | |
| 1. | 28207 | 52.4% | 8.5% (+43.9)#1 | 11.4% (+41.0)#228 |
| 2. | 28668 | 39.2% | 8.5% (+30.7)#2 | 11.4% (+27.8)#695 |
| 3. | 27608 | 36.9% | 8.5% (+28.4)#3 | 11.4% (+25.5)#845 |
| 4. | 28480 | 36.8% | 8.5% (+28.3)#4 | 11.4% (+25.4)#852 |
| 5. | 28036 | 35.2% | 8.5% (+26.7)#5 | 11.4% (+23.8)#963 |
| 6. | 28173 | 33.7% | 8.5% (+25.2)#6 | 11.4% (+22.3)#1,087 |
| 7. | 27519 | 33.1% | 8.5% (+24.6)#7 | 11.4% (+21.7)#1,146 |
| 8. | 27310 | 30.3% | 8.5% (+21.8)#8 | 11.4% (+18.9)#1,426 |
| 9. | 28774 | 30.3% | 8.5% (+21.8)#9 | 11.4% (+18.9)#1,429 |
| 10. | 28211 | 30.0% | 8.5% (+21.5)#10 | 11.4% (+18.6)#1,452 |
| 11. | 28226 | 28.4% | 8.5% (+19.9)#11 | 11.4% (+17.0)#1,661 |
| 12. | 28104 | 28.1% | 8.5% (+19.6)#12 | 11.4% (+16.7)#1,700 |
| 13. | 27358 | 28.1% | 8.5% (+19.6)#13 | 11.4% (+16.7)#1,706 |
| 14. | 27517 | 27.8% | 8.5% (+19.3)#14 | 11.4% (+16.4)#1,755 |
| 15. | 27523 | 27.1% | 8.5% (+18.6)#15 | 11.4% (+15.7)#1,861 |
| 16. | 27539 | 26.9% | 8.5% (+18.4)#16 | 11.4% (+15.5)#1,893 |
| 17. | 27514 | 26.6% | 8.5% (+18.1)#17 | 11.4% (+15.2)#1,931 |
| 18. | 28270 | 26.4% | 8.5% (+17.9)#18 | 11.4% (+15.0)#1,963 |
| 19. | 27614 | 26.2% | 8.5% (+17.7)#19 | 11.4% (+14.8)#1,998 |
| 20. | 27982 | 26.1% | 8.5% (+17.6)#20 | 11.4% (+14.7)#2,024 |
| 21. | 27502 | 25.4% | 8.5% (+16.9)#21 | 11.4% (+14.0)#2,112 |
| 22. | 28031 | 25.3% | 8.5% (+16.8)#22 | 11.4% (+13.9)#2,126 |
| 23. | 27518 | 25.3% | 8.5% (+16.8)#23 | 11.4% (+13.9)#2,132 |
| 24. | 27513 | 25.1% | 8.5% (+16.6)#24 | 11.4% (+13.7)#2,167 |
| 25. | 28277 | 24.5% | 8.5% (+16.0)#25 | 11.4% (+13.1)#2,273 |
| 26. | 27613 | 24.4% | 8.5% (+15.9)#26 | 11.4% (+13.0)#2,291 |
| 27. | 28037 | 24.0% | 8.5% (+15.5)#27 | 11.4% (+12.6)#2,368 |
| 28. | 27587 | 23.9% | 8.5% (+15.4)#28 | 11.4% (+12.5)#2,385 |
| 29. | 27562 | 23.9% | 8.5% (+15.4)#29 | 11.4% (+12.5)#2,399 |
| 30. | 27516 | 23.7% | 8.5% (+15.2)#30 | 11.4% (+12.3)#2,424 |
| 31. | 28078 | 22.6% | 8.5% (+14.1)#31 | 11.4% (+11.2)#2,646 |
| 32. | 28682 | 22.6% | 8.5% (+14.1)#32 | 11.4% (+11.2)#2,667 |
| 33. | 28117 | 22.5% | 8.5% (+14.0)#33 | 11.4% (+11.1)#2,675 |
| 34. | 28075 | 22.1% | 8.5% (+13.6)#34 | 11.4% (+10.7)#2,754 |
| 35. | 28553 | 21.8% | 8.5% (+13.3)#35 | 11.4% (+10.4)#2,836 |
| 36. | 27571 | 20.8% | 8.5% (+12.3)#36 | 11.4% (+9.40)#3,084 |
| 37. | 28449 | 20.5% | 8.5% (+12.0)#37 | 11.4% (+9.10)#3,167 |
| 38. | 28203 | 20.2% | 8.5% (+11.7)#38 | 11.4% (+8.80)#3,234 |
| 39. | 27540 | 19.9% | 8.5% (+11.4)#39 | 11.4% (+8.50)#3,306 |
| 40. | 28374 | 19.9% | 8.5% (+11.4)#40 | 11.4% (+8.50)#3,320 |
| 41. | 28209 | 19.8% | 8.5% (+11.3)#41 | 11.4% (+8.40)#3,343 |
| 42. | 27612 | 19.7% | 8.5% (+11.2)#42 | 11.4% (+8.30)#3,363 |
| 43. | 28278 | 19.6% | 8.5% (+11.1)#43 | 11.4% (+8.20)#3,389 |
| 44. | 27615 | 19.0% | 8.5% (+10.5)#44 | 11.4% (+7.60)#3,559 |
| 45. | 27551 | 18.8% | 8.5% (+10.3)#45 | 11.4% (+7.40)#3,629 |
| 46. | 27343 | 18.8% | 8.5% (+10.3)#46 | 11.4% (+7.40)#3,631 |
| 47. | 27607 | 18.4% | 8.5% (+9.90)#47 | 11.4% (+7.00)#3,726 |
| 48. | 27278 | 18.3% | 8.5% (+9.80)#48 | 11.4% (+6.90)#3,748 |
| 49. | 28646 | 18.2% | 8.5% (+9.70)#49 | 11.4% (+6.80)#3,800 |
| 50. | 28594 | 18.1% | 8.5% (+9.60)#50 | 11.4% (+6.70)#3,827 |
| 51. | 28577 | 18.1% | 8.5% (+9.60)#51 | 11.4% (+6.70)#3,835 |
| 52. | 28210 | 17.8% | 8.5% (+9.30)#52 | 11.4% (+6.40)#3,897 |
| 53. | 27949 | 17.6% | 8.5% (+9.10)#53 | 11.4% (+6.20)#3,977 |
| 54. | 27312 | 17.5% | 8.5% (+9.00)#54 | 11.4% (+6.10)#4,013 |
| 55. | 27408 | 17.4% | 8.5% (+8.90)#55 | 11.4% (+6.00)#4,043 |
| 56. | 27560 | 17.2% | 8.5% (+8.70)#56 | 11.4% (+5.80)#4,098 |
| 57. | 28202 | 17.0% | 8.5% (+8.50)#57 | 11.4% (+5.60)#4,192 |
| 58. | 27617 | 16.9% | 8.5% (+8.40)#58 | 11.4% (+5.50)#4,226 |
| 59. | 28409 | 16.7% | 8.5% (+8.20)#59 | 11.4% (+5.30)#4,287 |
| 60. | 27455 | 16.1% | 8.5% (+7.60)#60 | 11.4% (+4.70)#4,517 |
| 61. | 27527 | 16.0% | 8.5% (+7.50)#61 | 11.4% (+4.60)#4,555 |
| 62. | 27104 | 15.7% | 8.5% (+7.20)#62 | 11.4% (+4.30)#4,687 |
| 63. | 27601 | 15.6% | 8.5% (+7.10)#63 | 11.4% (+4.20)#4,729 |
| 64. | 28673 | 15.5% | 8.5% (+7.00)#64 | 11.4% (+4.10)#4,774 |
| 65. | 28428 | 15.4% | 8.5% (+6.90)#65 | 11.4% (+4.00)#4,814 |
| 66. | 27511 | 15.3% | 8.5% (+6.80)#66 | 11.4% (+3.90)#4,845 |
| 67. | 28804 | 15.3% | 8.5% (+6.80)#67 | 11.4% (+3.90)#4,850 |
| 68. | 27929 | 15.3% | 8.5% (+6.80)#68 | 11.4% (+3.90)#4,867 |
| 69. | 27503 | 15.2% | 8.5% (+6.70)#69 | 11.4% (+3.80)#4,903 |
| 70. | 27712 | 15.1% | 8.5% (+6.60)#70 | 11.4% (+3.70)#4,939 |
| 71. | 28465 | 14.4% | 8.5% (+5.90)#71 | 11.4% (+3.00)#5,271 |
| 72. | 27357 | 14.3% | 8.5% (+5.80)#72 | 11.4% (+2.90)#5,314 |
| 73. | 28788 | 14.3% | 8.5% (+5.80)#73 | 11.4% (+2.90)#5,337 |
| 74. | 28701 | 14.2% | 8.5% (+5.70)#74 | 11.4% (+2.80)#5,374 |
| 75. | 28605 | 14.2% | 8.5% (+5.70)#75 | 11.4% (+2.80)#5,378 |
| 76. | 27609 | 14.1% | 8.5% (+5.60)#76 | 11.4% (+2.70)#5,409 |
| 77. | 27009 | 14.1% | 8.5% (+5.60)#77 | 11.4% (+2.70)#5,437 |
| 78. | 27927 | 14.0% | 8.5% (+5.50)#78 | 11.4% (+2.60)#5,493 |
| 79. | 27853 | 13.9% | 8.5% (+5.40)#79 | 11.4% (+2.50)#5,550 |
| 80. | 28012 | 13.8% | 8.5% (+5.30)#80 | 11.4% (+2.40)#5,565 |
| 81. | 27959 | 13.8% | 8.5% (+5.30)#81 | 11.4% (+2.40)#5,588 |
| 82. | 28027 | 13.7% | 8.5% (+5.20)#82 | 11.4% (+2.30)#5,610 |
| 83. | 27713 | 13.6% | 8.5% (+5.10)#83 | 11.4% (+2.20)#5,671 |
| 84. | 27023 | 13.3% | 8.5% (+4.80)#84 | 11.4% (+1.90)#5,850 |
| 85. | 28746 | 13.2% | 8.5% (+4.70)#85 | 11.4% (+1.80)#5,922 |
| 86. | 28105 | 13.0% | 8.5% (+4.50)#86 | 11.4% (+1.60)#5,998 |
| 87. | 27291 | 13.0% | 8.5% (+4.50)#87 | 11.4% (+1.60)#6,051 |
| 88. | 27954 | 12.8% | 8.5% (+4.30)#88 | 11.4% (+1.40)#6,151 |
| 89. | 28745 | 12.8% | 8.5% (+4.30)#89 | 11.4% (+1.40)#6,181 |
| 90. | 27006 | 12.6% | 8.5% (+4.10)#90 | 11.4% (+1.20)#6,275 |
| 91. | 27235 | 12.6% | 8.5% (+4.10)#91 | 11.4% (+1.20)#6,290 |
| 92. | 27040 | 12.5% | 8.5% (+4.00)#92 | 11.4% (+1.10)#6,345 |
| 93. | 28742 | 12.4% | 8.5% (+3.90)#93 | 11.4% (+1.000)#6,433 |
| 94. | 27281 | 12.3% | 8.5% (+3.80)#94 | 11.4% (+0.900)#6,496 |
| 95. | 27958 | 12.2% | 8.5% (+3.70)#95 | 11.4% (+0.800)#6,541 |
| 96. | 28736 | 12.2% | 8.5% (+3.70)#96 | 11.4% (+0.800)#6,568 |
| 97. | 27705 | 12.1% | 8.5% (+3.60)#97 | 11.4% (+0.700)#6,588 |
| 98. | 28079 | 12.1% | 8.5% (+3.60)#98 | 11.4% (+0.700)#6,589 |
| 99. | 27012 | 12.1% | 8.5% (+3.60)#99 | 11.4% (+0.700)#6,598 |
| 100. | 28445 | 11.9% | 8.5% (+3.40)#100 | 11.4% (+0.500)#6,742 |
Common Questions
What are the Top 10 Zip Codes with the Highest Percentage of Households with Income Above $200,000 in North Carolina?
Top 10 Zip Codes with the Highest Percentage of Households with Income Above $200,000 in North Carolina are:
What zip code has the Highest Percentage of Households with Income Above $200,000 in North Carolina?
28207 has the Highest Percentage of Households with Income Above $200,000 in North Carolina with 52.4%.
What is the Percentage of Households with Income Above $200,000 in the State of North Carolina?
Percentage of Households with Income Above $200,000 in North Carolina is 8.5%.
What is the Percentage of Households with Income Above $200,000 in the United States?
Percentage of Households with Income Above $200,000 in the United States is 11.4%.