Zip Codes with the Highest Percentage of Population Employed in Legal Services & Support in Pontiac, MI
RELATED REPORTS & OPTIONS
Legal Services & Support
Pontiac
Compare Zip Codes
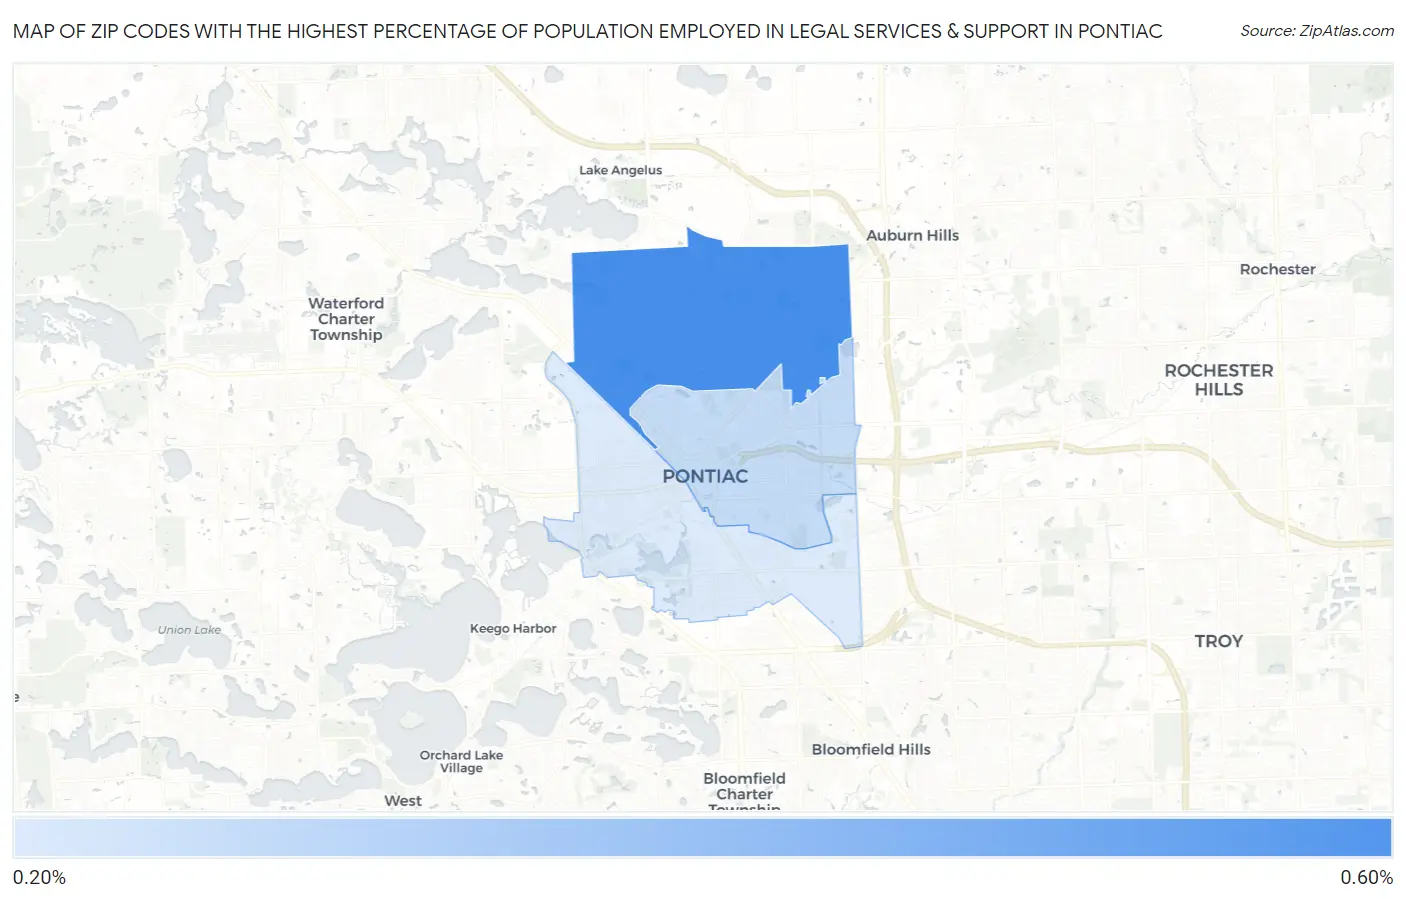
Map of Zip Codes with the Highest Percentage of Population Employed in Legal Services & Support in Pontiac
0.20%
0.54%
Zip Codes with the Highest Percentage of Population Employed in Legal Services & Support in Pontiac, MI
| Zip Code | % Employed | vs State | vs National | |
| 1. | 48340 | 0.54% | 0.89%(-0.341)#359 | 1.2%(-0.639)#12,117 |
| 2. | 48342 | 0.25% | 0.89%(-0.630)#517 | 1.2%(-0.929)#15,573 |
| 3. | 48341 | 0.20% | 0.89%(-0.681)#544 | 1.2%(-0.979)#16,142 |
1
Common Questions
What are the Top Zip Codes with the Highest Percentage of Population Employed in Legal Services & Support in Pontiac, MI?
Top Zip Codes with the Highest Percentage of Population Employed in Legal Services & Support in Pontiac, MI are:
What zip code has the Highest Percentage of Population Employed in Legal Services & Support in Pontiac, MI?
48340 has the Highest Percentage of Population Employed in Legal Services & Support in Pontiac, MI with 0.54%.
What is the Percentage of Population Employed in Legal Services & Support in Pontiac, MI?
Percentage of Population Employed in Legal Services & Support in Pontiac is 0.35%.
What is the Percentage of Population Employed in Legal Services & Support in Michigan?
Percentage of Population Employed in Legal Services & Support in Michigan is 0.89%.
What is the Percentage of Population Employed in Legal Services & Support in the United States?
Percentage of Population Employed in Legal Services & Support in the United States is 1.2%.