Zip Codes with the Highest Percentage of Population Employed in Health Diagnosing & Treating in Owensboro, KY
RELATED REPORTS & OPTIONS
Health Diagnosing & Treating
Owensboro
Compare Zip Codes
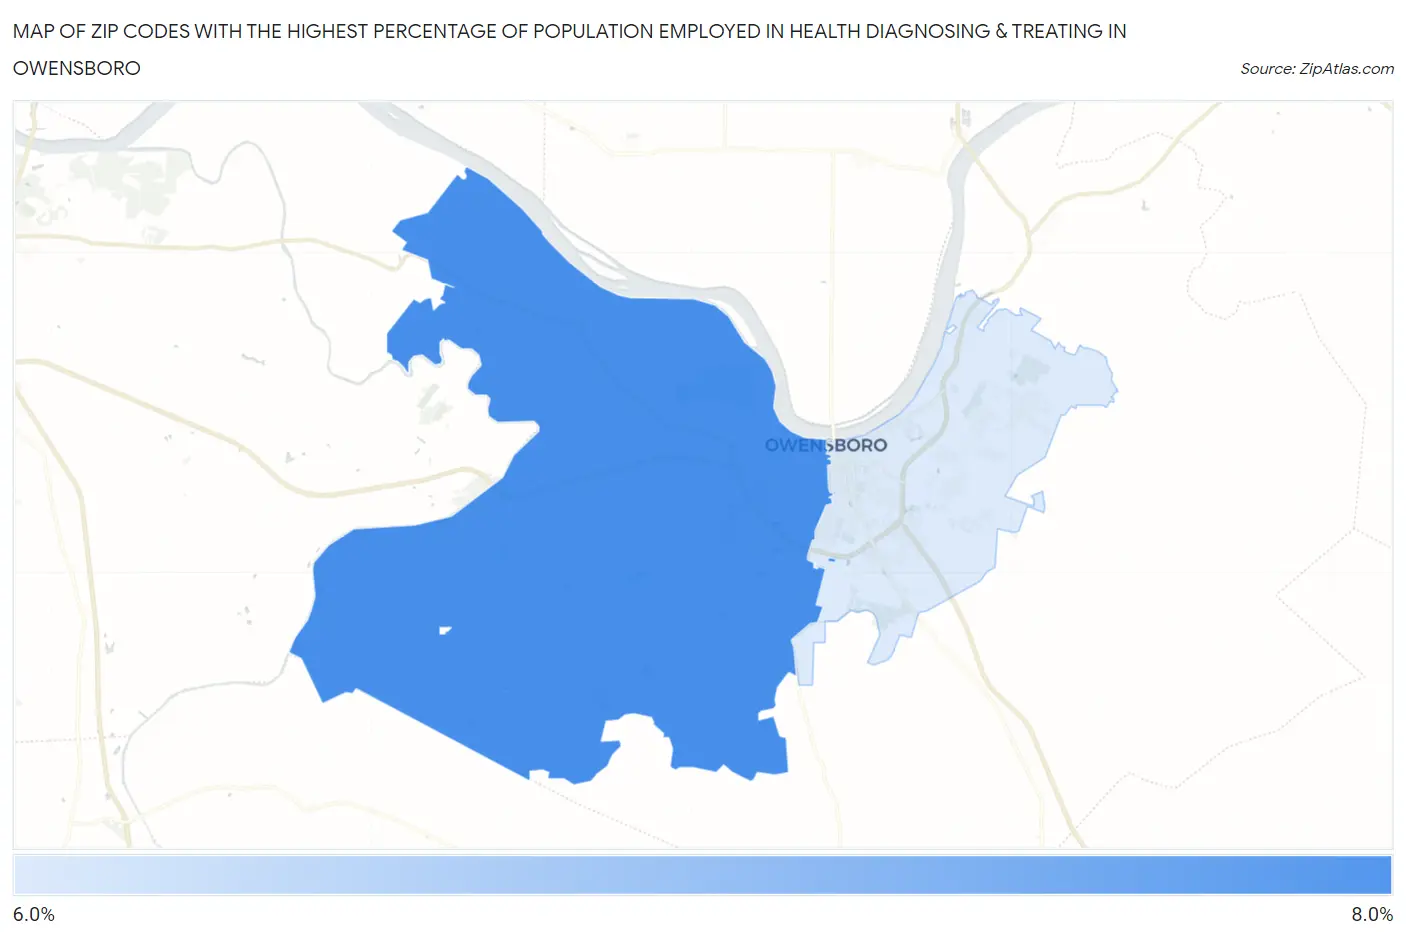
Map of Zip Codes with the Highest Percentage of Population Employed in Health Diagnosing & Treating in Owensboro
6.7%
7.0%
Zip Codes with the Highest Percentage of Population Employed in Health Diagnosing & Treating in Owensboro, KY
| Zip Code | % Employed | vs State | vs National | |
| 1. | 42301 | 7.0% | 7.2%(-0.185)#299 | 6.2%(+0.780)#10,287 |
| 2. | 42303 | 6.7% | 7.2%(-0.512)#315 | 6.2%(+0.453)#11,312 |
1
Common Questions
What are the Top Zip Codes with the Highest Percentage of Population Employed in Health Diagnosing & Treating in Owensboro, KY?
Top Zip Codes with the Highest Percentage of Population Employed in Health Diagnosing & Treating in Owensboro, KY are:
What zip code has the Highest Percentage of Population Employed in Health Diagnosing & Treating in Owensboro, KY?
42301 has the Highest Percentage of Population Employed in Health Diagnosing & Treating in Owensboro, KY with 7.0%.
What is the Percentage of Population Employed in Health Diagnosing & Treating in Owensboro, KY?
Percentage of Population Employed in Health Diagnosing & Treating in Owensboro is 7.4%.
What is the Percentage of Population Employed in Health Diagnosing & Treating in Kentucky?
Percentage of Population Employed in Health Diagnosing & Treating in Kentucky is 7.2%.
What is the Percentage of Population Employed in Health Diagnosing & Treating in the United States?
Percentage of Population Employed in Health Diagnosing & Treating in the United States is 6.2%.