Zip Codes with the Highest Percentage of Population Employed in Farming, Fishing & Forestry in Owensboro, KY
RELATED REPORTS & OPTIONS
Farming, Fishing & Forestry
Owensboro
Compare Zip Codes
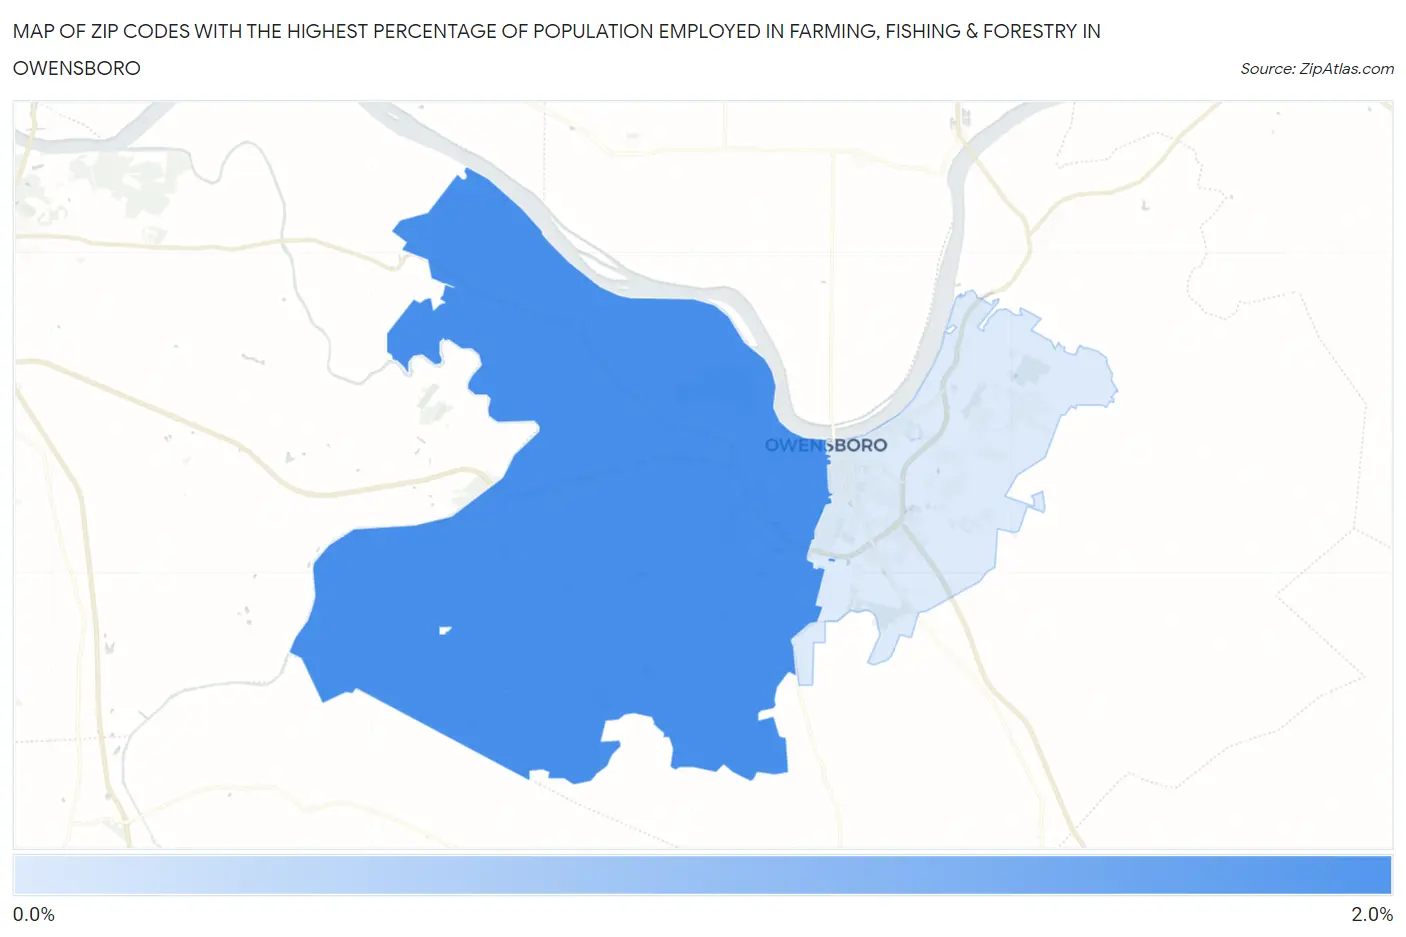
Map of Zip Codes with the Highest Percentage of Population Employed in Farming, Fishing & Forestry in Owensboro
0.38%
1.5%
Zip Codes with the Highest Percentage of Population Employed in Farming, Fishing & Forestry in Owensboro, KY
| Zip Code | % Employed | vs State | vs National | |
| 1. | 42301 | 1.5% | 0.52%(+0.999)#109 | 0.61%(+0.911)#7,832 |
| 2. | 42303 | 0.38% | 0.52%(-0.137)#218 | 0.61%(-0.225)#13,947 |
1
Common Questions
What are the Top Zip Codes with the Highest Percentage of Population Employed in Farming, Fishing & Forestry in Owensboro, KY?
Top Zip Codes with the Highest Percentage of Population Employed in Farming, Fishing & Forestry in Owensboro, KY are:
What zip code has the Highest Percentage of Population Employed in Farming, Fishing & Forestry in Owensboro, KY?
42301 has the Highest Percentage of Population Employed in Farming, Fishing & Forestry in Owensboro, KY with 1.5%.
What is the Percentage of Population Employed in Farming, Fishing & Forestry in Owensboro, KY?
Percentage of Population Employed in Farming, Fishing & Forestry in Owensboro is 0.36%.
What is the Percentage of Population Employed in Farming, Fishing & Forestry in Kentucky?
Percentage of Population Employed in Farming, Fishing & Forestry in Kentucky is 0.52%.
What is the Percentage of Population Employed in Farming, Fishing & Forestry in the United States?
Percentage of Population Employed in Farming, Fishing & Forestry in the United States is 0.61%.