Zip Codes with the Highest Percentage of Households Without a Vehicle in Owensboro, KY
RELATED REPORTS & OPTIONS
Households without a Cars
Owensboro
Compare Zip Codes
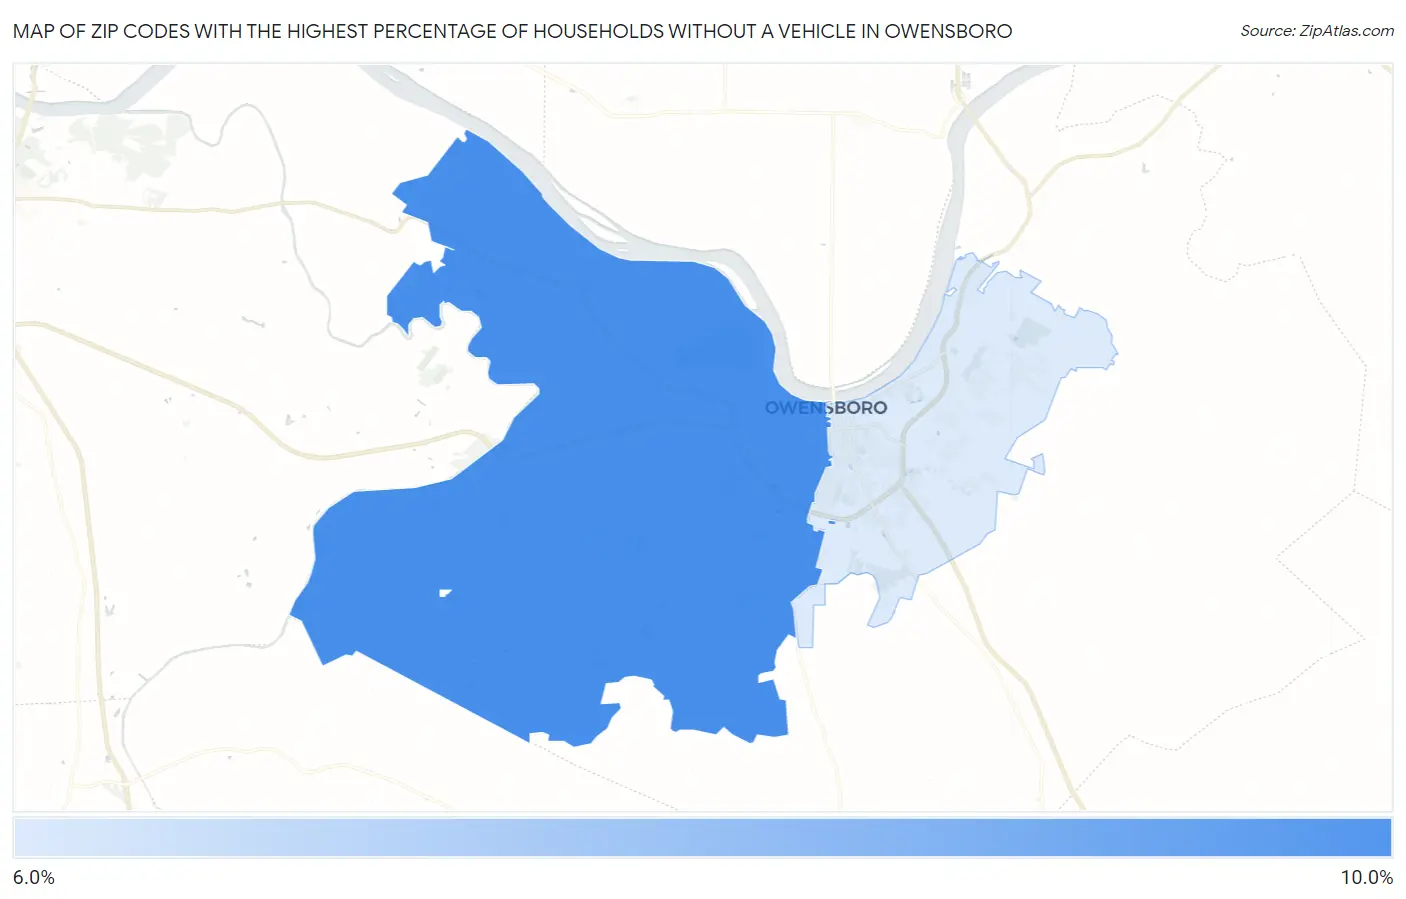
Map of Zip Codes with the Highest Percentage of Households Without a Vehicle in Owensboro
6.9%
8.3%
Zip Codes with the Highest Percentage of Households Without a Vehicle in Owensboro, KY
| Zip Code | Housholds Without a Car | vs State | vs National | |
| 1. | 42301 | 8.3% | 6.7%(+1.60)#203 | 8.3%(=0.000)#6,526 |
| 2. | 42303 | 6.9% | 6.7%(+0.200)#255 | 8.3%(-1.40)#8,696 |
1
Common Questions
What are the Top Zip Codes with the Highest Percentage of Households Without a Vehicle in Owensboro, KY?
Top Zip Codes with the Highest Percentage of Households Without a Vehicle in Owensboro, KY are:
What zip code has the Highest Percentage of Households Without a Vehicle in Owensboro, KY?
42301 has the Highest Percentage of Households Without a Vehicle in Owensboro, KY with 8.3%.
What is the Percentage of Households Without a Vehicle in Owensboro, KY?
Percentage of Households Without a Vehicle in Owensboro is 9.8%.
What is the Percentage of Households Without a Vehicle in Kentucky?
Percentage of Households Without a Vehicle in Kentucky is 6.7%.
What is the Percentage of Households Without a Vehicle in the United States?
Percentage of Households Without a Vehicle in the United States is 8.3%.