Zip Codes with the Highest Percentage of Population Employed in Manufacturing in Owensboro, KY
RELATED REPORTS & OPTIONS
Manufacturing
Owensboro
Compare Zip Codes
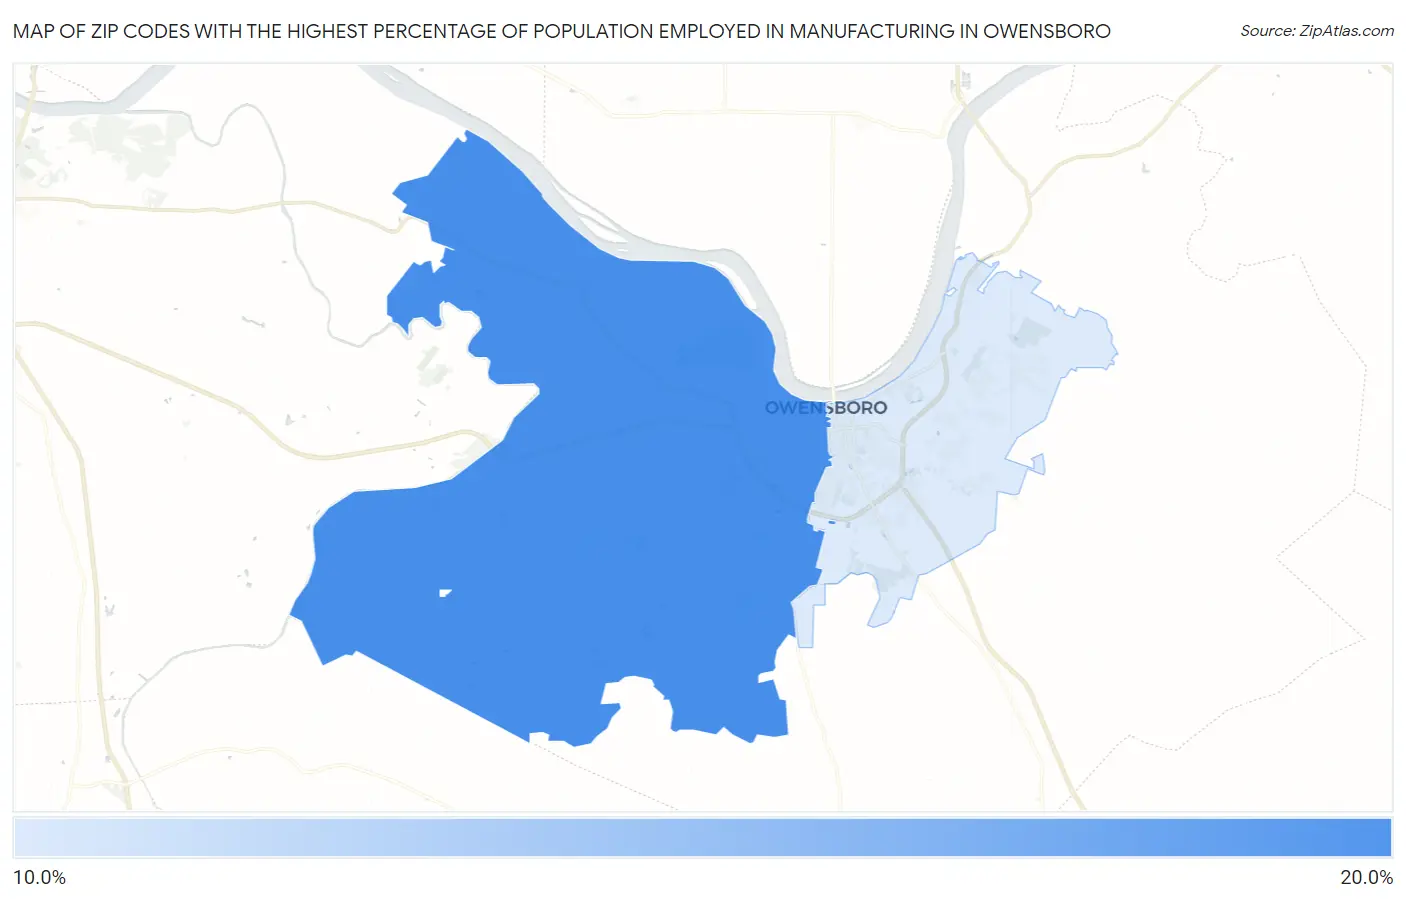
Map of Zip Codes with the Highest Percentage of Population Employed in Manufacturing in Owensboro
16.0%
17.7%
Zip Codes with the Highest Percentage of Population Employed in Manufacturing in Owensboro, KY
| Zip Code | % Employed | vs State | vs National | |
| 1. | 42301 | 17.7% | 14.2%(+3.48)#239 | 10.0%(+7.70)#6,556 |
| 2. | 42303 | 16.0% | 14.2%(+1.79)#279 | 10.0%(+6.01)#8,013 |
1
Common Questions
What are the Top Zip Codes with the Highest Percentage of Population Employed in Manufacturing in Owensboro, KY?
Top Zip Codes with the Highest Percentage of Population Employed in Manufacturing in Owensboro, KY are:
What zip code has the Highest Percentage of Population Employed in Manufacturing in Owensboro, KY?
42301 has the Highest Percentage of Population Employed in Manufacturing in Owensboro, KY with 17.7%.
What is the Percentage of Population Employed in Manufacturing in Owensboro, KY?
Percentage of Population Employed in Manufacturing in Owensboro is 16.3%.
What is the Percentage of Population Employed in Manufacturing in Kentucky?
Percentage of Population Employed in Manufacturing in Kentucky is 14.2%.
What is the Percentage of Population Employed in Manufacturing in the United States?
Percentage of Population Employed in Manufacturing in the United States is 10.0%.