Zip Codes with the Highest Percentage of Population Employed in Firefighting & Prevention in Arizona
RELATED REPORTS & OPTIONS
Firefighting & Prevention
Arizona
Compare Zip Codes
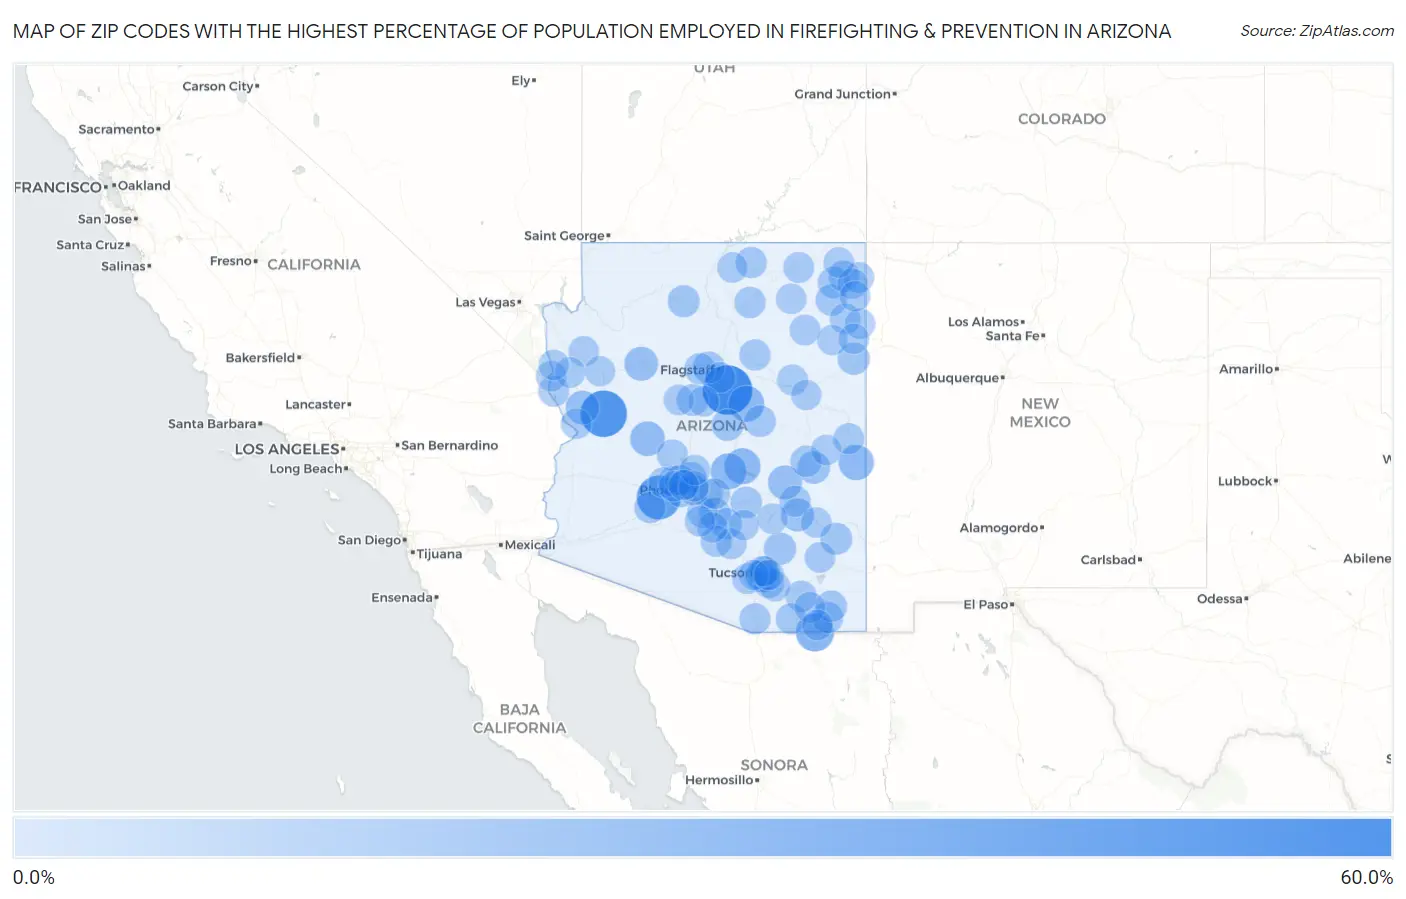
Map of Zip Codes with the Highest Percentage of Population Employed in Firefighting & Prevention in Arizona
0.0%
60.0%
Zip Codes with the Highest Percentage of Population Employed in Firefighting & Prevention in Arizona
| Zip Code | % Employed | vs State | vs National | |
| 1. | 86038 | 59.4% | 1.4%(+58.0)#1 | 1.2%(+58.2)#15 |
| 2. | 85360 | 50.0% | 1.4%(+48.6)#2 | 1.2%(+48.8)#20 |
| 3. | 85343 | 42.1% | 1.4%(+40.7)#3 | 1.2%(+40.9)#26 |
| 4. | 85620 | 24.4% | 1.4%(+23.0)#4 | 1.2%(+23.2)#64 |
| 5. | 86024 | 18.6% | 1.4%(+17.2)#5 | 1.2%(+17.4)#108 |
| 6. | 85553 | 18.3% | 1.4%(+17.0)#6 | 1.2%(+17.1)#110 |
| 7. | 85264 | 18.2% | 1.4%(+16.9)#7 | 1.2%(+17.0)#112 |
| 8. | 85920 | 16.5% | 1.4%(+15.1)#8 | 1.2%(+15.3)#136 |
| 9. | 85332 | 14.5% | 1.4%(+13.2)#9 | 1.2%(+13.3)#165 |
| 10. | 85550 | 12.5% | 1.4%(+11.2)#10 | 1.2%(+11.4)#209 |
| 11. | 86337 | 12.1% | 1.4%(+10.7)#11 | 1.2%(+10.9)#222 |
| 12. | 86438 | 11.5% | 1.4%(+10.2)#12 | 1.2%(+10.3)#250 |
| 13. | 85530 | 9.5% | 1.4%(+8.17)#13 | 1.2%(+8.34)#325 |
| 14. | 85926 | 8.4% | 1.4%(+7.05)#14 | 1.2%(+7.23)#373 |
| 15. | 85631 | 7.8% | 1.4%(+6.39)#15 | 1.2%(+6.57)#436 |
| 16. | 85708 | 6.9% | 1.4%(+5.58)#16 | 1.2%(+5.75)#520 |
| 17. | 86506 | 6.9% | 1.4%(+5.51)#17 | 1.2%(+5.68)#530 |
| 18. | 86023 | 6.7% | 1.4%(+5.35)#18 | 1.2%(+5.52)#555 |
| 19. | 85551 | 6.7% | 1.4%(+5.34)#19 | 1.2%(+5.51)#559 |
| 20. | 85329 | 6.6% | 1.4%(+5.26)#20 | 1.2%(+5.43)#571 |
| 21. | 86015 | 6.6% | 1.4%(+5.20)#21 | 1.2%(+5.37)#582 |
| 22. | 86331 | 6.2% | 1.4%(+4.86)#22 | 1.2%(+5.03)#642 |
| 23. | 85544 | 6.2% | 1.4%(+4.81)#23 | 1.2%(+4.98)#651 |
| 24. | 86538 | 5.8% | 1.4%(+4.46)#24 | 1.2%(+4.63)#702 |
| 25. | 85147 | 5.8% | 1.4%(+4.42)#25 | 1.2%(+4.60)#711 |
| 26. | 85931 | 5.8% | 1.4%(+4.41)#26 | 1.2%(+4.58)#714 |
| 27. | 85173 | 5.7% | 1.4%(+4.31)#27 | 1.2%(+4.48)#733 |
| 28. | 85617 | 5.2% | 1.4%(+3.83)#28 | 1.2%(+4.00)#840 |
| 29. | 85610 | 5.2% | 1.4%(+3.79)#29 | 1.2%(+3.96)#855 |
| 30. | 86503 | 5.1% | 1.4%(+3.69)#30 | 1.2%(+3.87)#889 |
| 31. | 85322 | 5.0% | 1.4%(+3.64)#31 | 1.2%(+3.81)#910 |
| 32. | 85707 | 4.9% | 1.4%(+3.52)#32 | 1.2%(+3.69)#957 |
| 33. | 85941 | 4.7% | 1.4%(+3.39)#33 | 1.2%(+3.56)#1,009 |
| 34. | 86045 | 4.7% | 1.4%(+3.33)#34 | 1.2%(+3.50)#1,031 |
| 35. | 86035 | 4.6% | 1.4%(+3.20)#35 | 1.2%(+3.37)#1,072 |
| 36. | 86053 | 4.5% | 1.4%(+3.18)#36 | 1.2%(+3.35)#1,085 |
| 37. | 86018 | 4.5% | 1.4%(+3.17)#37 | 1.2%(+3.35)#1,087 |
| 38. | 86547 | 4.5% | 1.4%(+3.17)#38 | 1.2%(+3.34)#1,088 |
| 39. | 85128 | 4.3% | 1.4%(+2.95)#39 | 1.2%(+3.12)#1,200 |
| 40. | 85542 | 4.1% | 1.4%(+2.77)#40 | 1.2%(+2.94)#1,289 |
| 41. | 85648 | 4.1% | 1.4%(+2.71)#41 | 1.2%(+2.89)#1,310 |
| 42. | 85630 | 3.9% | 1.4%(+2.54)#42 | 1.2%(+2.72)#1,409 |
| 43. | 85342 | 3.9% | 1.4%(+2.50)#43 | 1.2%(+2.67)#1,439 |
| 44. | 85123 | 3.8% | 1.4%(+2.41)#44 | 1.2%(+2.58)#1,495 |
| 45. | 85613 | 3.7% | 1.4%(+2.37)#45 | 1.2%(+2.54)#1,533 |
| 46. | 85938 | 3.7% | 1.4%(+2.35)#46 | 1.2%(+2.52)#1,547 |
| 47. | 86440 | 3.6% | 1.4%(+2.29)#47 | 1.2%(+2.46)#1,600 |
| 48. | 86032 | 3.6% | 1.4%(+2.25)#48 | 1.2%(+2.42)#1,631 |
| 49. | 86033 | 3.6% | 1.4%(+2.19)#49 | 1.2%(+2.37)#1,681 |
| 50. | 85638 | 3.4% | 1.4%(+2.00)#50 | 1.2%(+2.17)#1,856 |
| 51. | 85355 | 3.3% | 1.4%(+1.99)#51 | 1.2%(+2.16)#1,864 |
| 52. | 86544 | 3.2% | 1.4%(+1.88)#52 | 1.2%(+2.06)#1,966 |
| 53. | 85141 | 3.1% | 1.4%(+1.77)#53 | 1.2%(+1.94)#2,113 |
| 54. | 85757 | 3.0% | 1.4%(+1.60)#54 | 1.2%(+1.77)#2,305 |
| 55. | 86005 | 3.0% | 1.4%(+1.60)#55 | 1.2%(+1.77)#2,310 |
| 56. | 85053 | 2.9% | 1.4%(+1.58)#56 | 1.2%(+1.75)#2,329 |
| 57. | 85747 | 2.9% | 1.4%(+1.50)#57 | 1.2%(+1.67)#2,453 |
| 58. | 85603 | 2.7% | 1.4%(+1.39)#58 | 1.2%(+1.56)#2,644 |
| 59. | 86540 | 2.7% | 1.4%(+1.37)#59 | 1.2%(+1.55)#2,674 |
| 60. | 86034 | 2.7% | 1.4%(+1.36)#60 | 1.2%(+1.53)#2,698 |
| 61. | 86406 | 2.7% | 1.4%(+1.33)#61 | 1.2%(+1.50)#2,741 |
| 62. | 85121 | 2.7% | 1.4%(+1.30)#62 | 1.2%(+1.48)#2,783 |
| 63. | 85643 | 2.6% | 1.4%(+1.23)#63 | 1.2%(+1.40)#2,927 |
| 64. | 86442 | 2.6% | 1.4%(+1.21)#64 | 1.2%(+1.39)#2,949 |
| 65. | 86325 | 2.5% | 1.4%(+1.16)#65 | 1.2%(+1.33)#3,067 |
| 66. | 86409 | 2.5% | 1.4%(+1.15)#66 | 1.2%(+1.32)#3,079 |
| 67. | 86505 | 2.5% | 1.4%(+1.12)#67 | 1.2%(+1.29)#3,146 |
| 68. | 86507 | 2.5% | 1.4%(+1.11)#68 | 1.2%(+1.28)#3,165 |
| 69. | 85543 | 2.5% | 1.4%(+1.09)#69 | 1.2%(+1.26)#3,204 |
| 70. | 85396 | 2.4% | 1.4%(+1.09)#70 | 1.2%(+1.26)#3,208 |
| 71. | 86413 | 2.4% | 1.4%(+1.08)#71 | 1.2%(+1.25)#3,235 |
| 72. | 86504 | 2.4% | 1.4%(+1.03)#72 | 1.2%(+1.20)#3,367 |
| 73. | 86040 | 2.3% | 1.4%(+0.983)#73 | 1.2%(+1.15)#3,469 |
| 74. | 86429 | 2.3% | 1.4%(+0.968)#74 | 1.2%(+1.14)#3,500 |
| 75. | 86556 | 2.3% | 1.4%(+0.946)#75 | 1.2%(+1.12)#3,553 |
| 76. | 86323 | 2.3% | 1.4%(+0.945)#76 | 1.2%(+1.12)#3,555 |
| 77. | 85641 | 2.3% | 1.4%(+0.910)#77 | 1.2%(+1.08)#3,666 |
| 78. | 86510 | 2.2% | 1.4%(+0.885)#78 | 1.2%(+1.06)#3,735 |
| 79. | 85210 | 2.2% | 1.4%(+0.884)#79 | 1.2%(+1.06)#3,737 |
| 80. | 85303 | 2.2% | 1.4%(+0.851)#80 | 1.2%(+1.02)#3,837 |
| 81. | 85206 | 2.2% | 1.4%(+0.842)#81 | 1.2%(+1.01)#3,863 |
| 82. | 86511 | 2.2% | 1.4%(+0.832)#82 | 1.2%(+1.00)#3,895 |
| 83. | 85122 | 2.2% | 1.4%(+0.823)#83 | 1.2%(+0.994)#3,935 |
| 84. | 85192 | 2.2% | 1.4%(+0.802)#84 | 1.2%(+0.973)#3,988 |
| 85. | 85930 | 2.2% | 1.4%(+0.801)#85 | 1.2%(+0.972)#3,989 |
| 86. | 85335 | 2.2% | 1.4%(+0.795)#86 | 1.2%(+0.967)#4,009 |
| 87. | 85007 | 2.1% | 1.4%(+0.779)#87 | 1.2%(+0.951)#4,042 |
| 88. | 85712 | 2.1% | 1.4%(+0.775)#88 | 1.2%(+0.946)#4,062 |
| 89. | 85340 | 2.1% | 1.4%(+0.752)#89 | 1.2%(+0.924)#4,127 |
| 90. | 85012 | 2.1% | 1.4%(+0.727)#90 | 1.2%(+0.898)#4,202 |
| 91. | 86545 | 2.1% | 1.4%(+0.712)#91 | 1.2%(+0.883)#4,254 |
| 92. | 86401 | 2.1% | 1.4%(+0.703)#92 | 1.2%(+0.875)#4,293 |
| 93. | 85715 | 2.1% | 1.4%(+0.700)#93 | 1.2%(+0.871)#4,300 |
| 94. | 85132 | 2.0% | 1.4%(+0.690)#94 | 1.2%(+0.861)#4,341 |
| 95. | 85085 | 2.0% | 1.4%(+0.666)#95 | 1.2%(+0.837)#4,429 |
| 96. | 85138 | 2.0% | 1.4%(+0.665)#96 | 1.2%(+0.836)#4,432 |
| 97. | 85305 | 2.0% | 1.4%(+0.617)#97 | 1.2%(+0.788)#4,612 |
| 98. | 85713 | 2.0% | 1.4%(+0.612)#98 | 1.2%(+0.784)#4,627 |
| 99. | 85730 | 2.0% | 1.4%(+0.612)#99 | 1.2%(+0.783)#4,631 |
| 100. | 86025 | 2.0% | 1.4%(+0.603)#100 | 1.2%(+0.775)#4,657 |
Common Questions
What are the Top 10 Zip Codes with the Highest Percentage of Population Employed in Firefighting & Prevention in Arizona?
Top 10 Zip Codes with the Highest Percentage of Population Employed in Firefighting & Prevention in Arizona are:
What zip code has the Highest Percentage of Population Employed in Firefighting & Prevention in Arizona?
86038 has the Highest Percentage of Population Employed in Firefighting & Prevention in Arizona with 59.4%.
What is the Percentage of Population Employed in Firefighting & Prevention in the State of Arizona?
Percentage of Population Employed in Firefighting & Prevention in Arizona is 1.4%.
What is the Percentage of Population Employed in Firefighting & Prevention in the United States?
Percentage of Population Employed in Firefighting & Prevention in the United States is 1.2%.