Zip Codes with the Highest Percentage of Population Employed in Firefighting & Prevention in Louisiana
RELATED REPORTS & OPTIONS
Firefighting & Prevention
Louisiana
Compare Zip Codes
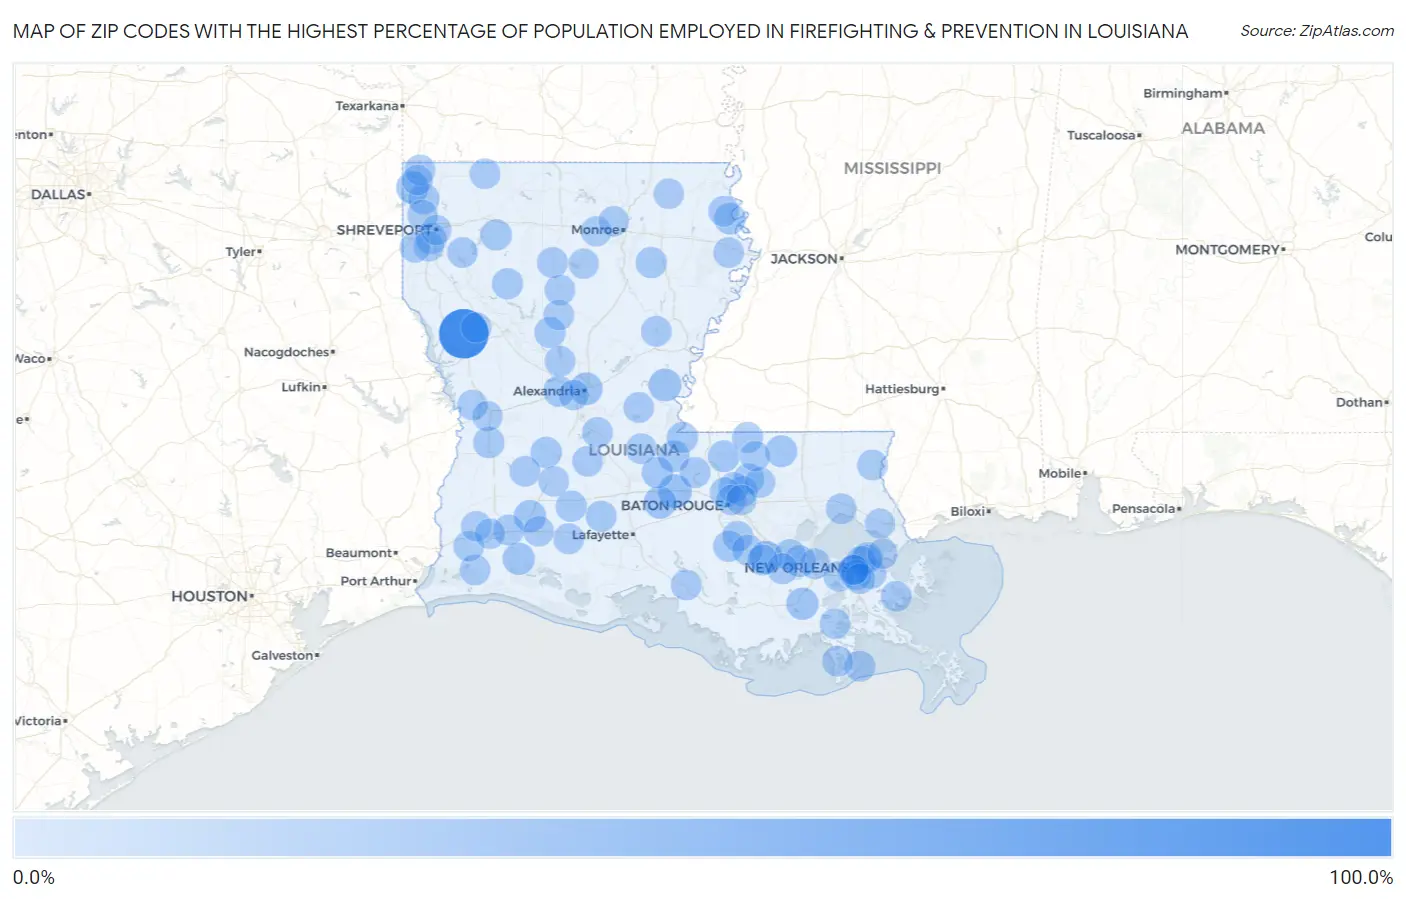
Map of Zip Codes with the Highest Percentage of Population Employed in Firefighting & Prevention in Louisiana
0.0%
100.0%
Zip Codes with the Highest Percentage of Population Employed in Firefighting & Prevention in Louisiana
| Zip Code | % Employed | vs State | vs National | |
| 1. | 71406 | 100.0% | 1.3%(+98.7)#1 | 1.2%(+98.8)#3 |
| 2. | 70756 | 18.2% | 1.3%(+16.9)#2 | 1.2%(+17.0)#111 |
| 3. | 70723 | 15.3% | 1.3%(+14.1)#3 | 1.2%(+14.2)#151 |
| 4. | 71354 | 13.5% | 1.3%(+12.2)#4 | 1.2%(+12.3)#189 |
| 5. | 71359 | 13.3% | 1.3%(+12.0)#5 | 1.2%(+12.1)#196 |
| 6. | 71082 | 12.9% | 1.3%(+11.6)#6 | 1.2%(+11.7)#202 |
| 7. | 70750 | 12.6% | 1.3%(+11.3)#7 | 1.2%(+11.4)#207 |
| 8. | 70640 | 11.9% | 1.3%(+10.6)#8 | 1.2%(+10.7)#232 |
| 9. | 70375 | 11.7% | 1.3%(+10.4)#9 | 1.2%(+10.5)#237 |
| 10. | 70630 | 11.2% | 1.3%(+9.92)#10 | 1.2%(+10.0)#255 |
| 11. | 70441 | 8.8% | 1.3%(+7.51)#11 | 1.2%(+7.61)#353 |
| 12. | 70748 | 8.4% | 1.3%(+7.11)#12 | 1.2%(+7.22)#374 |
| 13. | 70715 | 8.3% | 1.3%(+7.00)#13 | 1.2%(+7.11)#385 |
| 14. | 70049 | 8.2% | 1.3%(+6.92)#14 | 1.2%(+7.03)#391 |
| 15. | 71353 | 7.9% | 1.3%(+6.64)#15 | 1.2%(+6.75)#416 |
| 16. | 71276 | 7.9% | 1.3%(+6.57)#16 | 1.2%(+6.68)#425 |
| 17. | 70051 | 7.5% | 1.3%(+6.23)#17 | 1.2%(+6.34)#462 |
| 18. | 71004 | 7.1% | 1.3%(+5.81)#18 | 1.2%(+5.91)#502 |
| 19. | 71024 | 7.1% | 1.3%(+5.76)#19 | 1.2%(+5.86)#507 |
| 20. | 71259 | 6.8% | 1.3%(+5.55)#20 | 1.2%(+5.66)#537 |
| 21. | 70638 | 6.8% | 1.3%(+5.46)#21 | 1.2%(+5.57)#547 |
| 22. | 70659 | 6.6% | 1.3%(+5.34)#22 | 1.2%(+5.45)#570 |
| 23. | 70515 | 6.6% | 1.3%(+5.27)#23 | 1.2%(+5.38)#578 |
| 24. | 71404 | 6.1% | 1.3%(+4.81)#24 | 1.2%(+4.92)#658 |
| 25. | 70712 | 6.1% | 1.3%(+4.77)#25 | 1.2%(+4.87)#661 |
| 26. | 71002 | 5.9% | 1.3%(+4.59)#26 | 1.2%(+4.70)#691 |
| 27. | 70788 | 5.7% | 1.3%(+4.42)#27 | 1.2%(+4.53)#728 |
| 28. | 70516 | 5.4% | 1.3%(+4.07)#28 | 1.2%(+4.18)#791 |
| 29. | 71409 | 5.2% | 1.3%(+3.92)#29 | 1.2%(+4.02)#832 |
| 30. | 70090 | 5.0% | 1.3%(+3.74)#30 | 1.2%(+3.85)#898 |
| 31. | 70761 | 5.0% | 1.3%(+3.71)#31 | 1.2%(+3.81)#911 |
| 32. | 70760 | 4.9% | 1.3%(+3.66)#32 | 1.2%(+3.76)#930 |
| 33. | 70358 | 4.8% | 1.3%(+3.51)#33 | 1.2%(+3.61)#990 |
| 34. | 70556 | 4.7% | 1.3%(+3.40)#34 | 1.2%(+3.51)#1,024 |
| 35. | 71247 | 4.7% | 1.3%(+3.40)#35 | 1.2%(+3.51)#1,028 |
| 36. | 71108 | 4.5% | 1.3%(+3.16)#36 | 1.2%(+3.27)#1,123 |
| 37. | 70615 | 4.3% | 1.3%(+3.04)#37 | 1.2%(+3.15)#1,186 |
| 38. | 71044 | 4.3% | 1.3%(+3.01)#38 | 1.2%(+3.12)#1,204 |
| 39. | 70770 | 4.2% | 1.3%(+2.94)#39 | 1.2%(+3.05)#1,238 |
| 40. | 70721 | 4.2% | 1.3%(+2.94)#40 | 1.2%(+3.05)#1,240 |
| 41. | 70645 | 4.0% | 1.3%(+2.71)#41 | 1.2%(+2.82)#1,353 |
| 42. | 70514 | 4.0% | 1.3%(+2.69)#42 | 1.2%(+2.80)#1,369 |
| 43. | 71340 | 4.0% | 1.3%(+2.68)#43 | 1.2%(+2.79)#1,373 |
| 44. | 70357 | 3.9% | 1.3%(+2.60)#44 | 1.2%(+2.71)#1,413 |
| 45. | 70346 | 3.9% | 1.3%(+2.56)#45 | 1.2%(+2.67)#1,438 |
| 46. | 71351 | 3.8% | 1.3%(+2.55)#46 | 1.2%(+2.65)#1,450 |
| 47. | 71282 | 3.8% | 1.3%(+2.52)#47 | 1.2%(+2.63)#1,462 |
| 48. | 70447 | 3.8% | 1.3%(+2.48)#48 | 1.2%(+2.59)#1,491 |
| 49. | 70079 | 3.7% | 1.3%(+2.45)#49 | 1.2%(+2.56)#1,511 |
| 50. | 70427 | 3.7% | 1.3%(+2.41)#50 | 1.2%(+2.52)#1,548 |
| 51. | 70576 | 3.7% | 1.3%(+2.37)#51 | 1.2%(+2.48)#1,582 |
| 52. | 70085 | 3.6% | 1.3%(+2.34)#52 | 1.2%(+2.45)#1,610 |
| 53. | 70086 | 3.6% | 1.3%(+2.30)#53 | 1.2%(+2.41)#1,642 |
| 54. | 71325 | 3.6% | 1.3%(+2.30)#54 | 1.2%(+2.40)#1,650 |
| 55. | 71422 | 3.4% | 1.3%(+2.14)#55 | 1.2%(+2.25)#1,779 |
| 56. | 70665 | 3.4% | 1.3%(+2.14)#56 | 1.2%(+2.25)#1,780 |
| 57. | 71286 | 3.4% | 1.3%(+2.12)#57 | 1.2%(+2.23)#1,798 |
| 58. | 71362 | 3.4% | 1.3%(+2.12)#58 | 1.2%(+2.23)#1,799 |
| 59. | 70637 | 3.4% | 1.3%(+2.06)#59 | 1.2%(+2.17)#1,850 |
| 60. | 71051 | 3.3% | 1.3%(+2.03)#60 | 1.2%(+2.14)#1,878 |
| 61. | 71417 | 3.3% | 1.3%(+2.02)#61 | 1.2%(+2.13)#1,885 |
| 62. | 70094 | 3.3% | 1.3%(+2.00)#62 | 1.2%(+2.11)#1,907 |
| 63. | 70818 | 3.2% | 1.3%(+1.91)#63 | 1.2%(+2.01)#2,025 |
| 64. | 71043 | 3.2% | 1.3%(+1.90)#64 | 1.2%(+2.01)#2,034 |
| 65. | 71225 | 3.2% | 1.3%(+1.86)#65 | 1.2%(+1.97)#2,071 |
| 66. | 70113 | 3.1% | 1.3%(+1.84)#66 | 1.2%(+1.95)#2,091 |
| 67. | 70655 | 3.1% | 1.3%(+1.84)#67 | 1.2%(+1.95)#2,092 |
| 68. | 70127 | 3.1% | 1.3%(+1.79)#68 | 1.2%(+1.89)#2,150 |
| 69. | 71118 | 3.1% | 1.3%(+1.76)#69 | 1.2%(+1.87)#2,174 |
| 70. | 70345 | 3.0% | 1.3%(+1.72)#70 | 1.2%(+1.83)#2,221 |
| 71. | 70075 | 2.9% | 1.3%(+1.58)#71 | 1.2%(+1.69)#2,432 |
| 72. | 70128 | 2.8% | 1.3%(+1.55)#72 | 1.2%(+1.66)#2,470 |
| 73. | 71450 | 2.8% | 1.3%(+1.54)#73 | 1.2%(+1.65)#2,490 |
| 74. | 71072 | 2.8% | 1.3%(+1.54)#74 | 1.2%(+1.65)#2,505 |
| 75. | 71483 | 2.8% | 1.3%(+1.53)#75 | 1.2%(+1.63)#2,526 |
| 76. | 71226 | 2.8% | 1.3%(+1.51)#76 | 1.2%(+1.62)#2,567 |
| 77. | 70714 | 2.7% | 1.3%(+1.44)#77 | 1.2%(+1.55)#2,670 |
| 78. | 70663 | 2.7% | 1.3%(+1.44)#78 | 1.2%(+1.55)#2,676 |
| 79. | 71107 | 2.7% | 1.3%(+1.38)#79 | 1.2%(+1.49)#2,757 |
| 80. | 71129 | 2.6% | 1.3%(+1.35)#80 | 1.2%(+1.46)#2,803 |
| 81. | 70116 | 2.6% | 1.3%(+1.33)#81 | 1.2%(+1.44)#2,842 |
| 82. | 70126 | 2.6% | 1.3%(+1.33)#82 | 1.2%(+1.44)#2,846 |
| 83. | 70053 | 2.6% | 1.3%(+1.31)#83 | 1.2%(+1.42)#2,893 |
| 84. | 71403 | 2.6% | 1.3%(+1.30)#84 | 1.2%(+1.41)#2,913 |
| 85. | 71101 | 2.5% | 1.3%(+1.25)#85 | 1.2%(+1.36)#3,005 |
| 86. | 71461 | 2.5% | 1.3%(+1.23)#86 | 1.2%(+1.34)#3,045 |
| 87. | 70460 | 2.5% | 1.3%(+1.16)#87 | 1.2%(+1.27)#3,198 |
| 88. | 70056 | 2.5% | 1.3%(+1.16)#88 | 1.2%(+1.27)#3,200 |
| 89. | 70129 | 2.4% | 1.3%(+1.14)#89 | 1.2%(+1.25)#3,237 |
| 90. | 70807 | 2.4% | 1.3%(+1.12)#90 | 1.2%(+1.23)#3,287 |
| 91. | 70805 | 2.4% | 1.3%(+1.12)#91 | 1.2%(+1.23)#3,301 |
| 92. | 70112 | 2.4% | 1.3%(+1.10)#92 | 1.2%(+1.21)#3,338 |
| 93. | 70706 | 2.4% | 1.3%(+1.08)#93 | 1.2%(+1.19)#3,388 |
| 94. | 71303 | 2.4% | 1.3%(+1.08)#94 | 1.2%(+1.19)#3,404 |
| 95. | 71261 | 2.3% | 1.3%(+1.04)#95 | 1.2%(+1.15)#3,487 |
| 96. | 70814 | 2.3% | 1.3%(+1.02)#96 | 1.2%(+1.13)#3,524 |
| 97. | 70722 | 2.3% | 1.3%(+1.02)#97 | 1.2%(+1.13)#3,525 |
| 98. | 70591 | 2.3% | 1.3%(+0.986)#98 | 1.2%(+1.09)#3,618 |
| 99. | 71291 | 2.3% | 1.3%(+0.963)#99 | 1.2%(+1.07)#3,691 |
| 100. | 70669 | 2.2% | 1.3%(+0.950)#100 | 1.2%(+1.06)#3,722 |
Common Questions
What are the Top 10 Zip Codes with the Highest Percentage of Population Employed in Firefighting & Prevention in Louisiana?
Top 10 Zip Codes with the Highest Percentage of Population Employed in Firefighting & Prevention in Louisiana are:
What zip code has the Highest Percentage of Population Employed in Firefighting & Prevention in Louisiana?
71406 has the Highest Percentage of Population Employed in Firefighting & Prevention in Louisiana with 100.0%.
What is the Percentage of Population Employed in Firefighting & Prevention in the State of Louisiana?
Percentage of Population Employed in Firefighting & Prevention in Louisiana is 1.3%.
What is the Percentage of Population Employed in Firefighting & Prevention in the United States?
Percentage of Population Employed in Firefighting & Prevention in the United States is 1.2%.