Zip Codes with the Highest Percentage of Self-Employed / Not Incorporated in Bainbridge, GA
RELATED REPORTS & OPTIONS
Self-Employed / Not Incorporated
Bainbridge
Compare Zip Codes
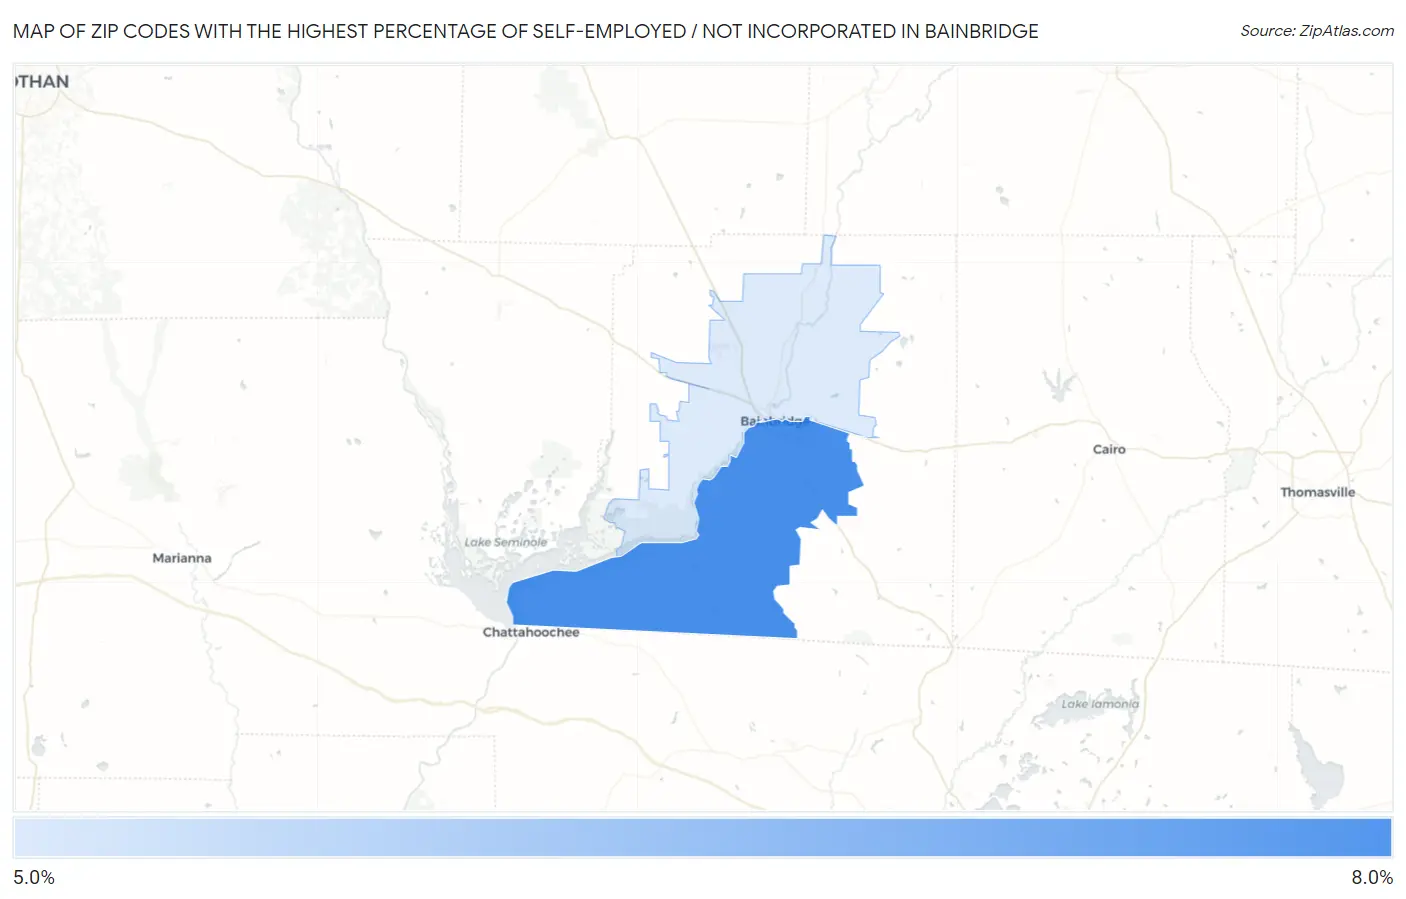
Map of Zip Codes with the Highest Percentage of Self-Employed / Not Incorporated in Bainbridge
0.0%
8.0%
Zip Codes with the Highest Percentage of Self-Employed / Not Incorporated in Bainbridge, GA
| Zip Code | % Self-Employed / Not Incorporated | vs State | vs National | |
| 1. | 39819 | 7.3% | 5.4%(+1.96)#180 | 5.8%(+1.50)#12,258 |
| 2. | 39817 | 5.4% | 5.4%(+0.013)#353 | 5.8%(-0.448)#18,256 |
1
Common Questions
What are the Top Zip Codes with the Highest Percentage of Self-Employed / Not Incorporated in Bainbridge, GA?
Top Zip Codes with the Highest Percentage of Self-Employed / Not Incorporated in Bainbridge, GA are:
What zip code has the Highest Percentage of Self-Employed / Not Incorporated in Bainbridge, GA?
39819 has the Highest Percentage of Self-Employed / Not Incorporated in Bainbridge, GA with 7.3%.
What is the Percentage of Self-Employed / Not Incorporated in Bainbridge, GA?
Percentage of Self-Employed / Not Incorporated in Bainbridge is 5.6%.
What is the Percentage of Self-Employed / Not Incorporated in Georgia?
Percentage of Self-Employed / Not Incorporated in Georgia is 5.4%.
What is the Percentage of Self-Employed / Not Incorporated in the United States?
Percentage of Self-Employed / Not Incorporated in the United States is 5.8%.