Zip Codes with the Highest Percentage of Population Employed in Accommodation & Food Services in Bainbridge, GA
RELATED REPORTS & OPTIONS
Accommodation & Food Services
Bainbridge
Compare Zip Codes
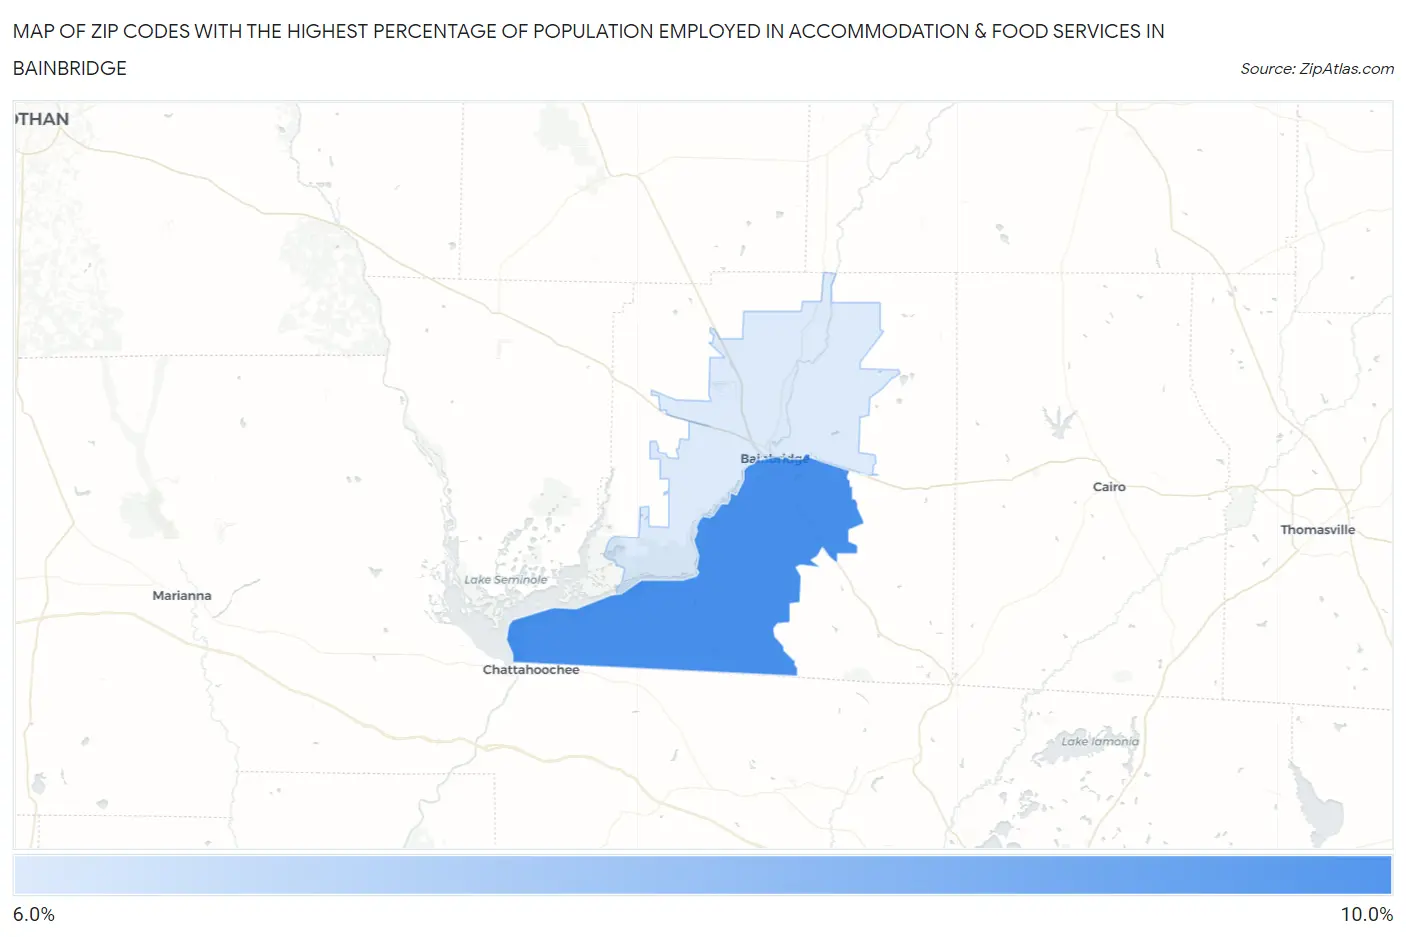
Map of Zip Codes with the Highest Percentage of Population Employed in Accommodation & Food Services in Bainbridge
6.5%
9.8%
Zip Codes with the Highest Percentage of Population Employed in Accommodation & Food Services in Bainbridge, GA
| Zip Code | % Employed | vs State | vs National | |
| 1. | 39819 | 9.8% | 7.2%(+2.55)#107 | 6.9%(+2.88)#4,846 |
| 2. | 39817 | 6.5% | 7.2%(-0.662)#318 | 6.9%(-0.337)#11,699 |
1
Common Questions
What are the Top Zip Codes with the Highest Percentage of Population Employed in Accommodation & Food Services in Bainbridge, GA?
Top Zip Codes with the Highest Percentage of Population Employed in Accommodation & Food Services in Bainbridge, GA are:
What zip code has the Highest Percentage of Population Employed in Accommodation & Food Services in Bainbridge, GA?
39819 has the Highest Percentage of Population Employed in Accommodation & Food Services in Bainbridge, GA with 9.8%.
What is the Percentage of Population Employed in Accommodation & Food Services in Bainbridge, GA?
Percentage of Population Employed in Accommodation & Food Services in Bainbridge is 10.2%.
What is the Percentage of Population Employed in Accommodation & Food Services in Georgia?
Percentage of Population Employed in Accommodation & Food Services in Georgia is 7.2%.
What is the Percentage of Population Employed in Accommodation & Food Services in the United States?
Percentage of Population Employed in Accommodation & Food Services in the United States is 6.9%.