Zip Codes with the Highest Percentage of Households Without a Vehicle in Bainbridge, GA
RELATED REPORTS & OPTIONS
Households without a Cars
Bainbridge
Compare Zip Codes
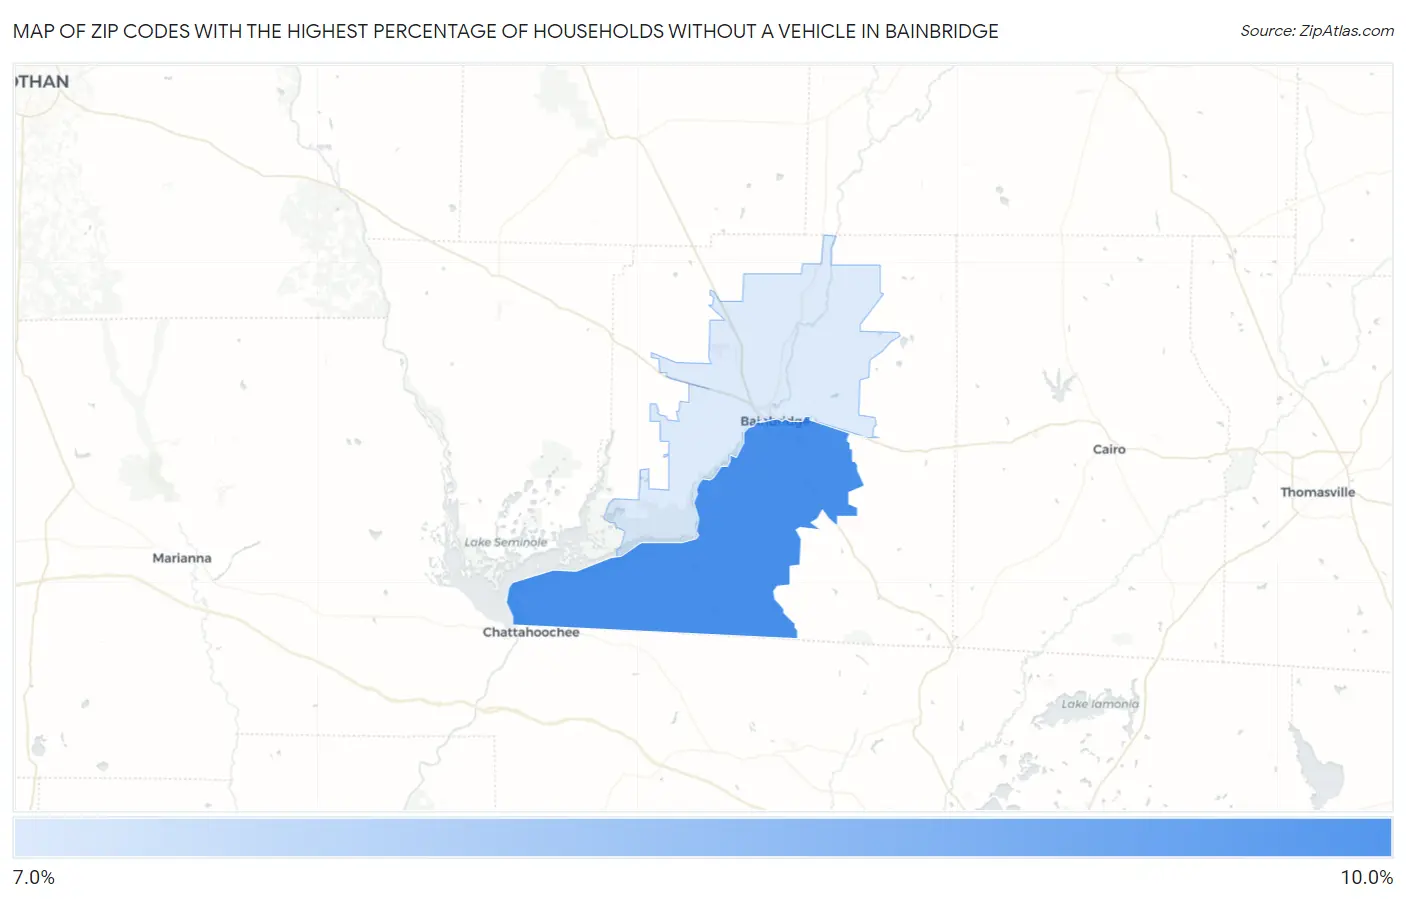
Map of Zip Codes with the Highest Percentage of Households Without a Vehicle in Bainbridge
7.9%
9.9%
Zip Codes with the Highest Percentage of Households Without a Vehicle in Bainbridge, GA
| Zip Code | Housholds Without a Car | vs State | vs National | |
| 1. | 39819 | 9.9% | 6.0%(+3.90)#117 | 8.3%(+1.60)#4,954 |
| 2. | 39817 | 7.9% | 6.0%(+1.90)#185 | 8.3%(-0.400)#7,133 |
1
Common Questions
What are the Top Zip Codes with the Highest Percentage of Households Without a Vehicle in Bainbridge, GA?
Top Zip Codes with the Highest Percentage of Households Without a Vehicle in Bainbridge, GA are:
What zip code has the Highest Percentage of Households Without a Vehicle in Bainbridge, GA?
39819 has the Highest Percentage of Households Without a Vehicle in Bainbridge, GA with 9.9%.
What is the Percentage of Households Without a Vehicle in Bainbridge, GA?
Percentage of Households Without a Vehicle in Bainbridge is 11.5%.
What is the Percentage of Households Without a Vehicle in Georgia?
Percentage of Households Without a Vehicle in Georgia is 6.0%.
What is the Percentage of Households Without a Vehicle in the United States?
Percentage of Households Without a Vehicle in the United States is 8.3%.