Bangladeshi College, 1 year or more
COMPARE
Bangladeshi
Select to Compare
College, 1 year or more
Bangladeshi College, 1 year or more
54.5%
COLLEGE, 1 YEAR OR MORE
0.2/ 100
METRIC RATING
269th/ 347
METRIC RANK
Bangladeshi College, 1 year or more Correlation Chart
The statistical analysis conducted on geographies consisting of 141,449,898 people shows a mild negative correlation between the proportion of Bangladeshis and percentage of population with at least college, 1 year or more education in the United States with a correlation coefficient (R) of -0.385 and weighted average of 54.5%. On average, for every 1% (one percent) increase in Bangladeshis within a typical geography, there is a decrease of 0.33% in percentage of population with at least college, 1 year or more education.
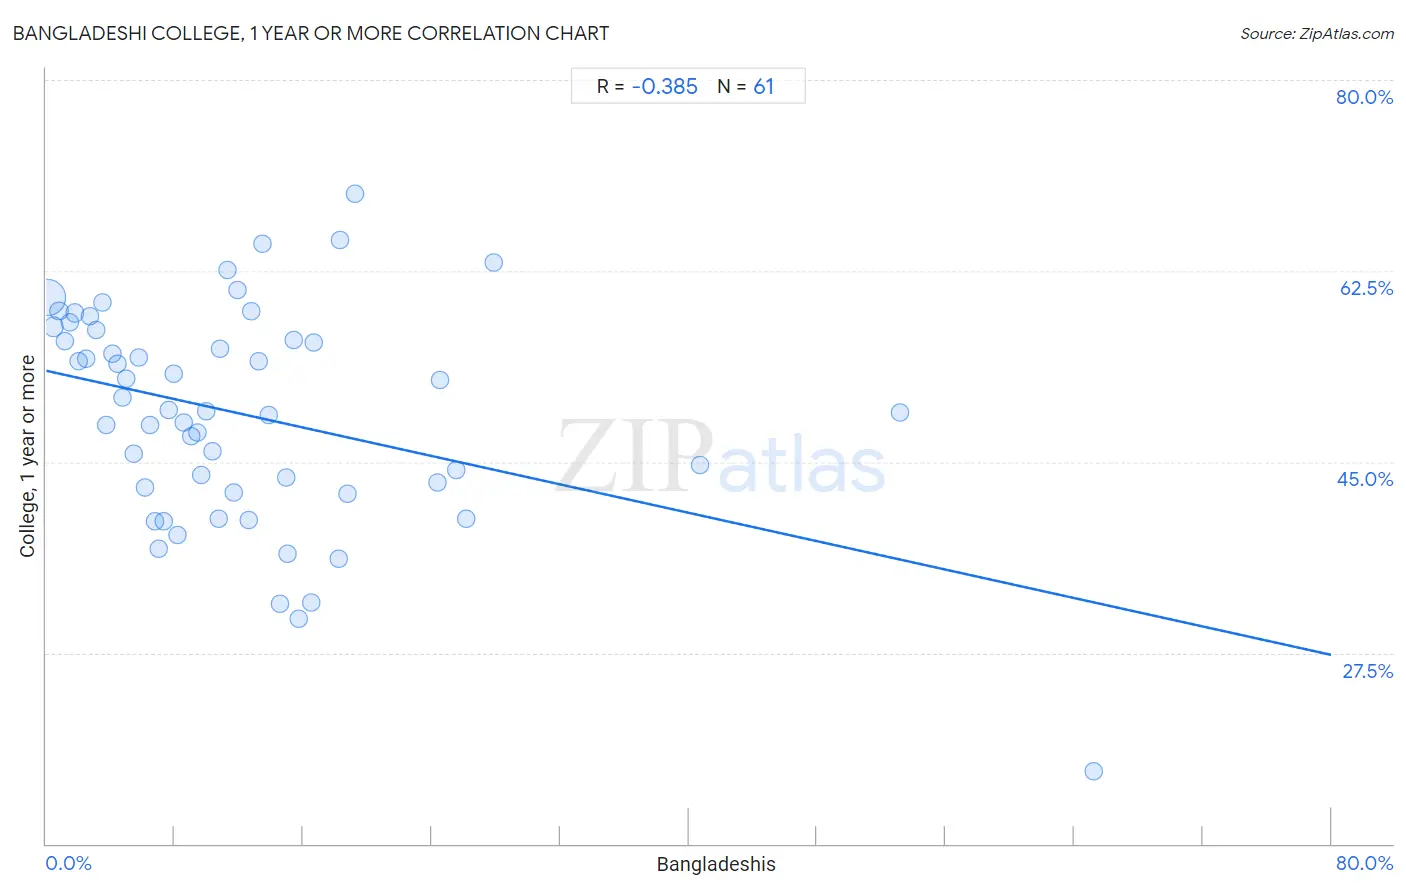
It is essential to understand that the correlation between the percentage of Bangladeshis and percentage of population with at least college, 1 year or more education does not imply a direct cause-and-effect relationship. It remains uncertain whether the presence of Bangladeshis influences an upward or downward trend in the level of percentage of population with at least college, 1 year or more education within an area, or if Bangladeshis simply ended up residing in those areas with higher or lower levels of percentage of population with at least college, 1 year or more education due to other factors.
Demographics Similar to Bangladeshis by College, 1 year or more
In terms of college, 1 year or more, the demographic groups most similar to Bangladeshis are British West Indian (54.5%, a difference of 0.030%), Crow (54.5%, a difference of 0.030%), Bahamian (54.5%, a difference of 0.060%), Comanche (54.4%, a difference of 0.10%), and Immigrants from Grenada (54.4%, a difference of 0.14%).
| Demographics | Rating | Rank | College, 1 year or more |
| Immigrants from St. Vincent and the Grenadines | 0.3 /100 | #262 | Tragic 54.8% |
| U.S. Virgin Islanders | 0.3 /100 | #263 | Tragic 54.8% |
| Immigrants from Micronesia | 0.3 /100 | #264 | Tragic 54.8% |
| Immigrants from Laos | 0.2 /100 | #265 | Tragic 54.7% |
| Potawatomi | 0.2 /100 | #266 | Tragic 54.6% |
| Blackfeet | 0.2 /100 | #267 | Tragic 54.6% |
| British West Indians | 0.2 /100 | #268 | Tragic 54.5% |
| Bangladeshis | 0.2 /100 | #269 | Tragic 54.5% |
| Crow | 0.2 /100 | #270 | Tragic 54.5% |
| Bahamians | 0.2 /100 | #271 | Tragic 54.5% |
| Comanche | 0.2 /100 | #272 | Tragic 54.4% |
| Immigrants from Grenada | 0.2 /100 | #273 | Tragic 54.4% |
| Belizeans | 0.2 /100 | #274 | Tragic 54.4% |
| Americans | 0.2 /100 | #275 | Tragic 54.4% |
| Shoshone | 0.2 /100 | #276 | Tragic 54.3% |
Bangladeshi College, 1 year or more Correlation Summary
| Measurement | Bangladeshi Data | College, 1 year or more Data |
| Minimum | 0.061% | 16.7% |
| Maximum | 65.2% | 69.6% |
| Range | 65.2% | 52.9% |
| Mean | 12.5% | 49.3% |
| Median | 10.0% | 49.6% |
| Interquartile 25% (IQ1) | 4.9% | 42.4% |
| Interquartile 75% (IQ3) | 15.6% | 56.6% |
| Interquartile Range (IQR) | 10.7% | 14.2% |
| Standard Deviation (Sample) | 11.8% | 10.0% |
| Standard Deviation (Population) | 11.7% | 9.9% |
Correlation Details
| Bangladeshi Percentile | Sample Size | College, 1 year or more |
[ 0.0% - 0.5% ] 0.061% | 114,912,374 | 60.1% |
[ 0.0% - 0.5% ] 0.45% | 8,757,862 | 57.4% |
[ 0.5% - 1.0% ] 0.80% | 3,567,516 | 58.8% |
[ 1.0% - 1.5% ] 1.16% | 1,841,972 | 56.1% |
[ 1.0% - 1.5% ] 1.45% | 1,973,214 | 57.8% |
[ 1.5% - 2.0% ] 1.75% | 2,130,389 | 58.6% |
[ 2.0% - 2.5% ] 2.04% | 1,196,311 | 54.3% |
[ 2.0% - 2.5% ] 2.47% | 721,978 | 54.5% |
[ 2.5% - 3.0% ] 2.73% | 624,931 | 58.3% |
[ 3.0% - 3.5% ] 3.13% | 471,590 | 57.1% |
[ 3.0% - 3.5% ] 3.47% | 937,434 | 59.6% |
[ 3.5% - 4.0% ] 3.73% | 329,616 | 48.4% |
[ 4.0% - 4.5% ] 4.10% | 538,756 | 54.9% |
[ 4.0% - 4.5% ] 4.42% | 290,997 | 54.0% |
[ 4.5% - 5.0% ] 4.76% | 30,701 | 50.9% |
[ 4.5% - 5.0% ] 4.98% | 761,348 | 52.6% |
[ 5.0% - 5.5% ] 5.48% | 167,360 | 45.7% |
[ 5.5% - 6.0% ] 5.77% | 107,730 | 54.5% |
[ 6.0% - 6.5% ] 6.12% | 174,810 | 42.7% |
[ 6.0% - 6.5% ] 6.44% | 63,612 | 48.4% |
[ 6.5% - 7.0% ] 6.76% | 170,696 | 39.5% |
[ 6.5% - 7.0% ] 6.99% | 50,484 | 37.1% |
[ 7.0% - 7.5% ] 7.32% | 10,557 | 39.6% |
[ 7.5% - 8.0% ] 7.66% | 37,988 | 49.8% |
[ 7.5% - 8.0% ] 7.92% | 42,735 | 53.0% |
[ 8.0% - 8.5% ] 8.18% | 52,886 | 38.3% |
[ 8.5% - 9.0% ] 8.55% | 12,684 | 48.6% |
[ 9.0% - 9.5% ] 9.03% | 148,369 | 47.4% |
[ 9.0% - 9.5% ] 9.40% | 51,109 | 47.7% |
[ 9.5% - 10.0% ] 9.63% | 136,085 | 43.8% |
[ 9.5% - 10.0% ] 9.96% | 134,205 | 49.6% |
[ 10.0% - 10.5% ] 10.33% | 64,531 | 46.0% |
[ 10.5% - 11.0% ] 10.72% | 70,827 | 39.8% |
[ 10.5% - 11.0% ] 10.85% | 31,292 | 55.3% |
[ 11.0% - 11.5% ] 11.27% | 308,806 | 62.6% |
[ 11.5% - 12.0% ] 11.69% | 1,215 | 42.2% |
[ 11.5% - 12.0% ] 11.89% | 32,912 | 60.8% |
[ 12.5% - 13.0% ] 12.59% | 2,208 | 39.7% |
[ 12.5% - 13.0% ] 12.76% | 84,951 | 58.8% |
[ 13.0% - 13.5% ] 13.26% | 2,316 | 54.2% |
[ 13.0% - 13.5% ] 13.48% | 13,459 | 64.9% |
[ 13.5% - 14.0% ] 13.86% | 95,310 | 49.3% |
[ 14.5% - 15.0% ] 14.53% | 296 | 32.0% |
[ 14.5% - 15.0% ] 14.91% | 932 | 43.6% |
[ 15.0% - 15.5% ] 15.04% | 13,116 | 36.6% |
[ 15.0% - 15.5% ] 15.39% | 132,092 | 56.2% |
[ 15.5% - 16.0% ] 15.74% | 216 | 30.6% |
[ 16.0% - 16.5% ] 16.48% | 6,790 | 32.1% |
[ 16.5% - 17.0% ] 16.66% | 34,220 | 56.0% |
[ 18.0% - 18.5% ] 18.23% | 7,581 | 36.1% |
[ 18.0% - 18.5% ] 18.31% | 17,716 | 65.3% |
[ 18.5% - 19.0% ] 18.74% | 619 | 42.1% |
[ 19.0% - 19.5% ] 19.23% | 26 | 69.6% |
[ 24.0% - 24.5% ] 24.36% | 390 | 43.2% |
[ 24.5% - 25.0% ] 24.55% | 1,218 | 52.5% |
[ 25.5% - 26.0% ] 25.55% | 57,662 | 44.3% |
[ 26.0% - 26.5% ] 26.16% | 19,613 | 39.8% |
[ 27.5% - 28.0% ] 27.85% | 158 | 63.3% |
[ 40.5% - 41.0% ] 40.74% | 734 | 44.8% |
[ 53.0% - 53.5% ] 53.15% | 111 | 49.5% |
[ 65.0% - 65.5% ] 65.25% | 282 | 16.7% |