Immigrants from Honduras vs Cheyenne Disability Age Under 5
COMPARE
Immigrants from Honduras
Cheyenne
Disability Age Under 5
Disability Age Under 5 Comparison
Immigrants from Honduras
Cheyenne
1.2%
DISABILITY AGE UNDER 5
80.4/ 100
METRIC RATING
141st/ 347
METRIC RANK
1.5%
DISABILITY AGE UNDER 5
0.0/ 100
METRIC RATING
282nd/ 347
METRIC RANK
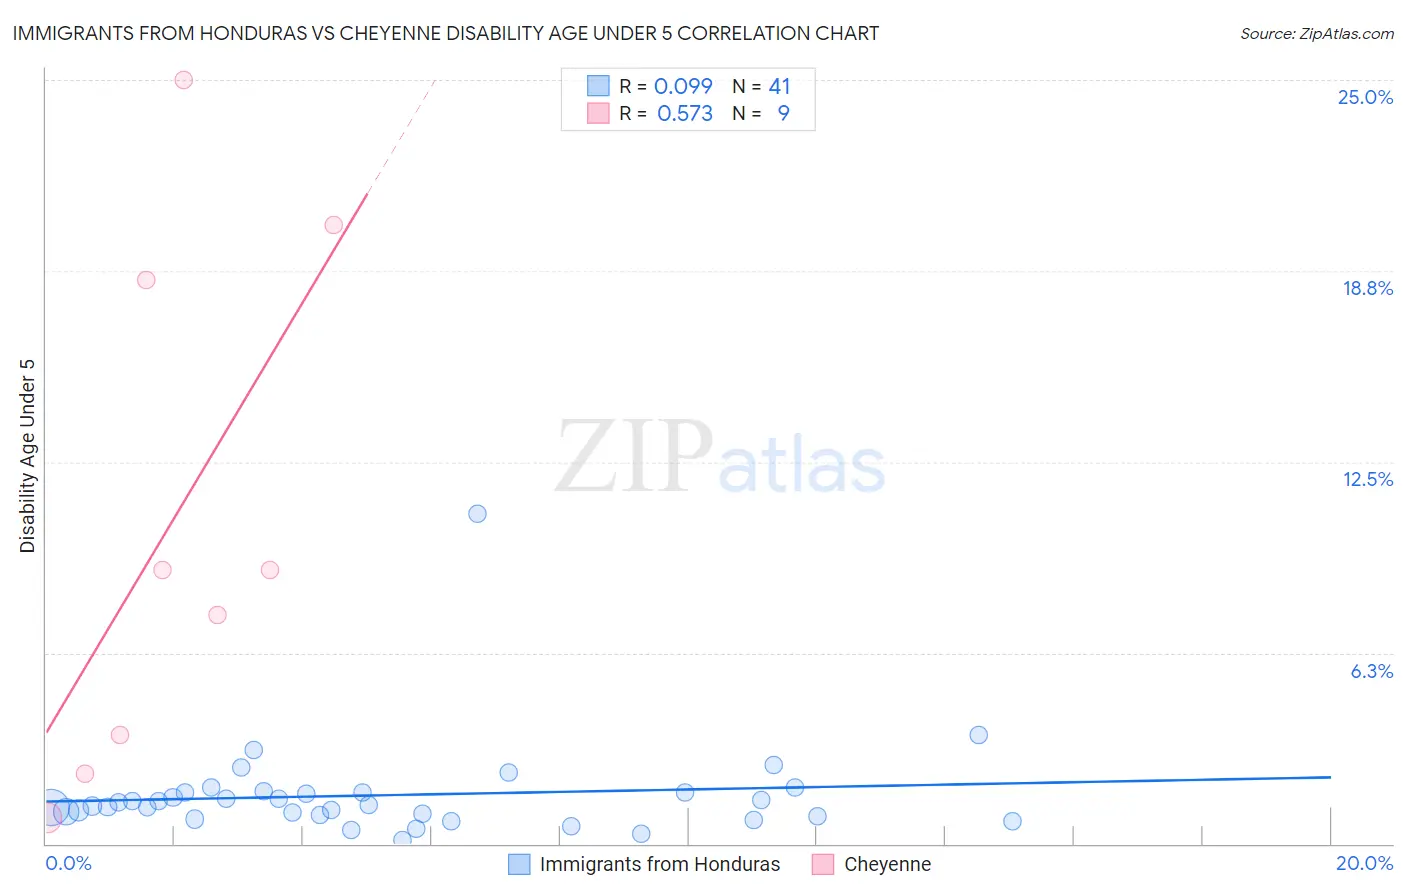
Immigrants from Honduras vs Cheyenne Disability Age Under 5 Correlation Chart
The statistical analysis conducted on geographies consisting of 190,855,678 people shows a slight positive correlation between the proportion of Immigrants from Honduras and percentage of population with a disability under the age of 5 in the United States with a correlation coefficient (R) of 0.099 and weighted average of 1.2%. Similarly, the statistical analysis conducted on geographies consisting of 66,176,849 people shows a substantial positive correlation between the proportion of Cheyenne and percentage of population with a disability under the age of 5 in the United States with a correlation coefficient (R) of 0.573 and weighted average of 1.5%, a difference of 26.4%.
Disability Age Under 5 Correlation Summary
| Measurement | Immigrants from Honduras | Cheyenne |
| Minimum | 0.13% | 0.85% |
| Maximum | 10.8% | 25.0% |
| Range | 10.7% | 24.1% |
| Mean | 1.6% | 10.6% |
| Median | 1.3% | 9.0% |
| Interquartile 25% (IQ1) | 0.93% | 2.9% |
| Interquartile 75% (IQ3) | 1.7% | 19.4% |
| Interquartile Range (IQR) | 0.76% | 16.4% |
| Standard Deviation (Sample) | 1.6% | 8.6% |
| Standard Deviation (Population) | 1.6% | 8.1% |
Similar Demographics by Disability Age Under 5
Demographics Similar to Immigrants from Honduras by Disability Age Under 5
In terms of disability age under 5, the demographic groups most similar to Immigrants from Honduras are Somali (1.2%, a difference of 0.060%), New Zealander (1.2%, a difference of 0.15%), Immigrants from Colombia (1.2%, a difference of 0.15%), Alsatian (1.2%, a difference of 0.16%), and Immigrants from Middle Africa (1.2%, a difference of 0.16%).
| Demographics | Rating | Rank | Disability Age Under 5 |
| Argentineans | 85.7 /100 | #134 | Excellent 1.2% |
| Fijians | 84.7 /100 | #135 | Excellent 1.2% |
| Moroccans | 83.6 /100 | #136 | Excellent 1.2% |
| Immigrants | Eastern Africa | 83.1 /100 | #137 | Excellent 1.2% |
| Immigrants | Czechoslovakia | 82.8 /100 | #138 | Excellent 1.2% |
| New Zealanders | 81.4 /100 | #139 | Excellent 1.2% |
| Somalis | 80.8 /100 | #140 | Excellent 1.2% |
| Immigrants | Honduras | 80.4 /100 | #141 | Excellent 1.2% |
| Immigrants | Colombia | 79.3 /100 | #142 | Good 1.2% |
| Alsatians | 79.3 /100 | #143 | Good 1.2% |
| Immigrants | Middle Africa | 79.3 /100 | #144 | Good 1.2% |
| Immigrants | Zimbabwe | 77.9 /100 | #145 | Good 1.2% |
| Samoans | 77.7 /100 | #146 | Good 1.2% |
| Icelanders | 76.3 /100 | #147 | Good 1.2% |
| Ghanaians | 76.3 /100 | #148 | Good 1.2% |
Demographics Similar to Cheyenne by Disability Age Under 5
In terms of disability age under 5, the demographic groups most similar to Cheyenne are Delaware (1.5%, a difference of 0.19%), European (1.5%, a difference of 0.25%), Czechoslovakian (1.5%, a difference of 0.34%), Croatian (1.5%, a difference of 1.4%), and Tlingit-Haida (1.5%, a difference of 1.7%).
| Demographics | Rating | Rank | Disability Age Under 5 |
| Brazilians | 0.0 /100 | #275 | Tragic 1.5% |
| Greeks | 0.0 /100 | #276 | Tragic 1.5% |
| Canadians | 0.0 /100 | #277 | Tragic 1.5% |
| Kiowa | 0.0 /100 | #278 | Tragic 1.5% |
| Danes | 0.0 /100 | #279 | Tragic 1.5% |
| British | 0.0 /100 | #280 | Tragic 1.5% |
| Czechoslovakians | 0.0 /100 | #281 | Tragic 1.5% |
| Cheyenne | 0.0 /100 | #282 | Tragic 1.5% |
| Delaware | 0.0 /100 | #283 | Tragic 1.5% |
| Europeans | 0.0 /100 | #284 | Tragic 1.5% |
| Croatians | 0.0 /100 | #285 | Tragic 1.5% |
| Tlingit-Haida | 0.0 /100 | #286 | Tragic 1.5% |
| Scandinavians | 0.0 /100 | #287 | Tragic 1.5% |
| Estonians | 0.0 /100 | #288 | Tragic 1.5% |
| Hungarians | 0.0 /100 | #289 | Tragic 1.5% |