Immigrants from Honduras vs Bermudan Disability Age Under 5
COMPARE
Immigrants from Honduras
Bermudan
Disability Age Under 5
Disability Age Under 5 Comparison
Immigrants from Honduras
Bermudans
1.2%
DISABILITY AGE UNDER 5
80.4/ 100
METRIC RATING
141st/ 347
METRIC RANK
1.4%
DISABILITY AGE UNDER 5
1.0/ 100
METRIC RATING
249th/ 347
METRIC RANK
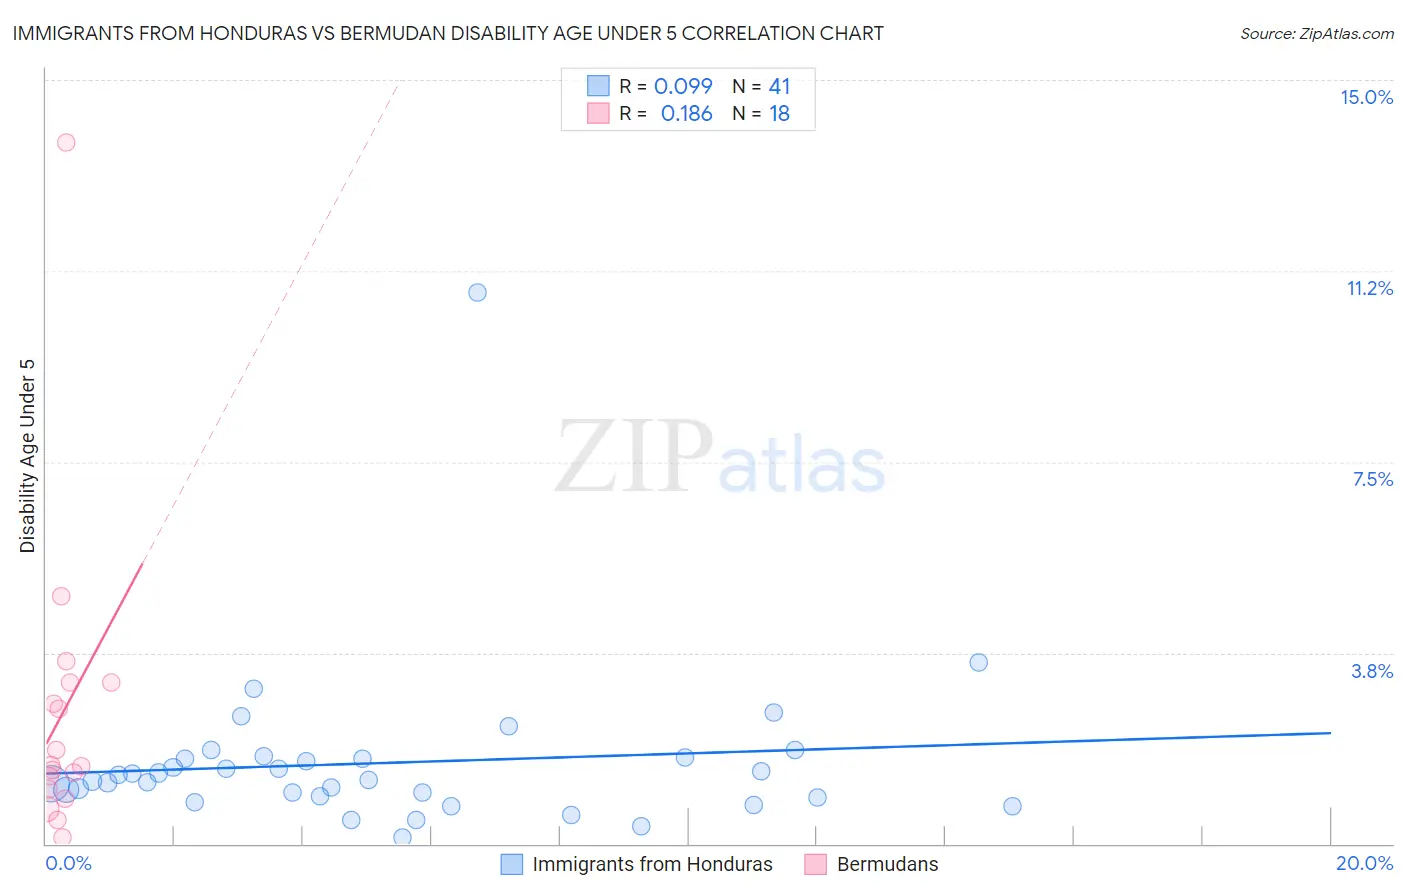
Immigrants from Honduras vs Bermudan Disability Age Under 5 Correlation Chart
The statistical analysis conducted on geographies consisting of 190,855,678 people shows a slight positive correlation between the proportion of Immigrants from Honduras and percentage of population with a disability under the age of 5 in the United States with a correlation coefficient (R) of 0.099 and weighted average of 1.2%. Similarly, the statistical analysis conducted on geographies consisting of 46,313,673 people shows a poor positive correlation between the proportion of Bermudans and percentage of population with a disability under the age of 5 in the United States with a correlation coefficient (R) of 0.186 and weighted average of 1.4%, a difference of 14.1%.
Disability Age Under 5 Correlation Summary
| Measurement | Immigrants from Honduras | Bermudan |
| Minimum | 0.13% | 0.12% |
| Maximum | 10.8% | 13.8% |
| Range | 10.7% | 13.6% |
| Mean | 1.6% | 2.6% |
| Median | 1.3% | 1.5% |
| Interquartile 25% (IQ1) | 0.93% | 1.1% |
| Interquartile 75% (IQ3) | 1.7% | 3.2% |
| Interquartile Range (IQR) | 0.76% | 2.1% |
| Standard Deviation (Sample) | 1.6% | 3.1% |
| Standard Deviation (Population) | 1.6% | 3.0% |
Similar Demographics by Disability Age Under 5
Demographics Similar to Immigrants from Honduras by Disability Age Under 5
In terms of disability age under 5, the demographic groups most similar to Immigrants from Honduras are Somali (1.2%, a difference of 0.060%), New Zealander (1.2%, a difference of 0.15%), Immigrants from Colombia (1.2%, a difference of 0.15%), Alsatian (1.2%, a difference of 0.16%), and Immigrants from Middle Africa (1.2%, a difference of 0.16%).
| Demographics | Rating | Rank | Disability Age Under 5 |
| Argentineans | 85.7 /100 | #134 | Excellent 1.2% |
| Fijians | 84.7 /100 | #135 | Excellent 1.2% |
| Moroccans | 83.6 /100 | #136 | Excellent 1.2% |
| Immigrants | Eastern Africa | 83.1 /100 | #137 | Excellent 1.2% |
| Immigrants | Czechoslovakia | 82.8 /100 | #138 | Excellent 1.2% |
| New Zealanders | 81.4 /100 | #139 | Excellent 1.2% |
| Somalis | 80.8 /100 | #140 | Excellent 1.2% |
| Immigrants | Honduras | 80.4 /100 | #141 | Excellent 1.2% |
| Immigrants | Colombia | 79.3 /100 | #142 | Good 1.2% |
| Alsatians | 79.3 /100 | #143 | Good 1.2% |
| Immigrants | Middle Africa | 79.3 /100 | #144 | Good 1.2% |
| Immigrants | Zimbabwe | 77.9 /100 | #145 | Good 1.2% |
| Samoans | 77.7 /100 | #146 | Good 1.2% |
| Icelanders | 76.3 /100 | #147 | Good 1.2% |
| Ghanaians | 76.3 /100 | #148 | Good 1.2% |
Demographics Similar to Bermudans by Disability Age Under 5
In terms of disability age under 5, the demographic groups most similar to Bermudans are African (1.4%, a difference of 0.010%), Immigrants from Hungary (1.4%, a difference of 0.040%), Eastern European (1.4%, a difference of 0.080%), Immigrants from Scotland (1.4%, a difference of 0.080%), and Immigrants from England (1.4%, a difference of 0.11%).
| Demographics | Rating | Rank | Disability Age Under 5 |
| Lumbee | 2.1 /100 | #242 | Tragic 1.3% |
| Immigrants | Cameroon | 1.7 /100 | #243 | Tragic 1.4% |
| Spaniards | 1.4 /100 | #244 | Tragic 1.4% |
| Potawatomi | 1.1 /100 | #245 | Tragic 1.4% |
| Russians | 1.0 /100 | #246 | Tragic 1.4% |
| Immigrants | England | 1.0 /100 | #247 | Tragic 1.4% |
| Eastern Europeans | 1.0 /100 | #248 | Tragic 1.4% |
| Bermudans | 1.0 /100 | #249 | Tragic 1.4% |
| Africans | 1.0 /100 | #250 | Tragic 1.4% |
| Immigrants | Hungary | 1.0 /100 | #251 | Tragic 1.4% |
| Immigrants | Scotland | 0.9 /100 | #252 | Tragic 1.4% |
| Australians | 0.7 /100 | #253 | Tragic 1.4% |
| Immigrants | Brazil | 0.7 /100 | #254 | Tragic 1.4% |
| Immigrants | Liberia | 0.6 /100 | #255 | Tragic 1.4% |
| Immigrants | Western Europe | 0.5 /100 | #256 | Tragic 1.4% |