Immigrants from Bangladesh vs Macedonian Disability Age Under 5
COMPARE
Immigrants from Bangladesh
Macedonian
Disability Age Under 5
Disability Age Under 5 Comparison
Immigrants from Bangladesh
Macedonians
0.85%
DISABILITY AGE UNDER 5
100.0/ 100
METRIC RATING
5th/ 347
METRIC RANK
1.2%
DISABILITY AGE UNDER 5
43.7/ 100
METRIC RATING
181st/ 347
METRIC RANK
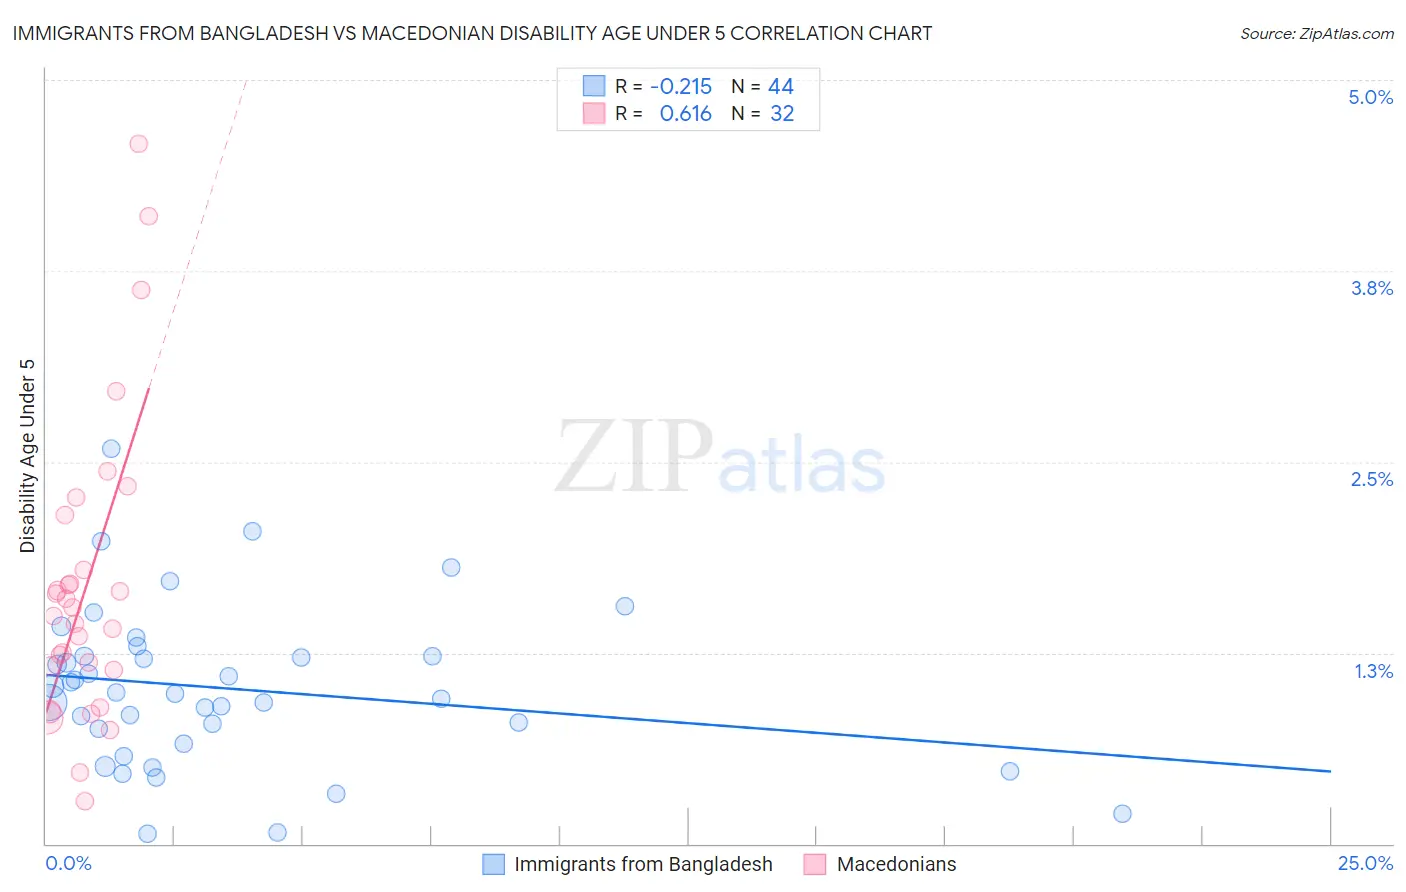
Immigrants from Bangladesh vs Macedonian Disability Age Under 5 Correlation Chart
The statistical analysis conducted on geographies consisting of 131,826,697 people shows a weak negative correlation between the proportion of Immigrants from Bangladesh and percentage of population with a disability under the age of 5 in the United States with a correlation coefficient (R) of -0.215 and weighted average of 0.85%. Similarly, the statistical analysis conducted on geographies consisting of 91,108,284 people shows a significant positive correlation between the proportion of Macedonians and percentage of population with a disability under the age of 5 in the United States with a correlation coefficient (R) of 0.616 and weighted average of 1.2%, a difference of 46.2%.
Disability Age Under 5 Correlation Summary
| Measurement | Immigrants from Bangladesh | Macedonian |
| Minimum | 0.063% | 0.28% |
| Maximum | 2.6% | 4.6% |
| Range | 2.5% | 4.3% |
| Mean | 1.0% | 1.7% |
| Median | 0.99% | 1.5% |
| Interquartile 25% (IQ1) | 0.70% | 1.1% |
| Interquartile 75% (IQ3) | 1.2% | 2.0% |
| Interquartile Range (IQR) | 0.53% | 0.82% |
| Standard Deviation (Sample) | 0.52% | 0.98% |
| Standard Deviation (Population) | 0.52% | 0.97% |
Similar Demographics by Disability Age Under 5
Demographics Similar to Immigrants from Bangladesh by Disability Age Under 5
In terms of disability age under 5, the demographic groups most similar to Immigrants from Bangladesh are Immigrants from Uzbekistan (0.85%, a difference of 0.41%), Ute (0.86%, a difference of 0.93%), Vietnamese (0.81%, a difference of 5.0%), Immigrants from Afghanistan (0.91%, a difference of 6.3%), and Immigrants from Yemen (0.91%, a difference of 6.4%).
| Demographics | Rating | Rank | Disability Age Under 5 |
| Immigrants | Armenia | 100.0 /100 | #1 | Exceptional 0.76% |
| Immigrants | St. Vincent and the Grenadines | 100.0 /100 | #2 | Exceptional 0.79% |
| Vietnamese | 100.0 /100 | #3 | Exceptional 0.81% |
| Immigrants | Uzbekistan | 100.0 /100 | #4 | Exceptional 0.85% |
| Immigrants | Bangladesh | 100.0 /100 | #5 | Exceptional 0.85% |
| Ute | 100.0 /100 | #6 | Exceptional 0.86% |
| Immigrants | Afghanistan | 100.0 /100 | #7 | Exceptional 0.91% |
| Immigrants | Yemen | 100.0 /100 | #8 | Exceptional 0.91% |
| Immigrants | Fiji | 100.0 /100 | #9 | Exceptional 0.92% |
| Marshallese | 100.0 /100 | #10 | Exceptional 0.94% |
| Afghans | 100.0 /100 | #11 | Exceptional 0.94% |
| Immigrants | Grenada | 100.0 /100 | #12 | Exceptional 0.94% |
| Soviet Union | 100.0 /100 | #13 | Exceptional 0.95% |
| Yuman | 100.0 /100 | #14 | Exceptional 0.95% |
| Immigrants | Hong Kong | 100.0 /100 | #15 | Exceptional 0.95% |
Demographics Similar to Macedonians by Disability Age Under 5
In terms of disability age under 5, the demographic groups most similar to Macedonians are Immigrants from Peru (1.2%, a difference of 0.0%), Immigrants from Saudi Arabia (1.2%, a difference of 0.040%), Palestinian (1.2%, a difference of 0.060%), Immigrants from Mexico (1.2%, a difference of 0.070%), and Immigrants from Western Africa (1.2%, a difference of 0.11%).
| Demographics | Rating | Rank | Disability Age Under 5 |
| Immigrants | Latvia | 50.0 /100 | #174 | Average 1.2% |
| Immigrants | Nigeria | 50.0 /100 | #175 | Average 1.2% |
| Immigrants | Kenya | 48.6 /100 | #176 | Average 1.2% |
| Comanche | 47.5 /100 | #177 | Average 1.2% |
| Venezuelans | 47.1 /100 | #178 | Average 1.2% |
| Immigrants | Bahamas | 45.2 /100 | #179 | Average 1.2% |
| Immigrants | Mexico | 44.4 /100 | #180 | Average 1.2% |
| Immigrants | Peru | 43.7 /100 | #181 | Average 1.2% |
| Macedonians | 43.7 /100 | #181 | Average 1.2% |
| Immigrants | Saudi Arabia | 43.3 /100 | #183 | Average 1.2% |
| Palestinians | 43.0 /100 | #184 | Average 1.2% |
| Immigrants | Western Africa | 42.5 /100 | #185 | Average 1.2% |
| Cubans | 42.5 /100 | #186 | Average 1.2% |
| Immigrants | Haiti | 40.2 /100 | #187 | Average 1.3% |
| Haitians | 39.9 /100 | #188 | Fair 1.3% |