Zip Codes with the Highest Percentage of Population Employed in Life, Physical & Social Science in Brighton, CO
RELATED REPORTS & OPTIONS
Life, Physical & Social Science
Brighton
Compare Zip Codes
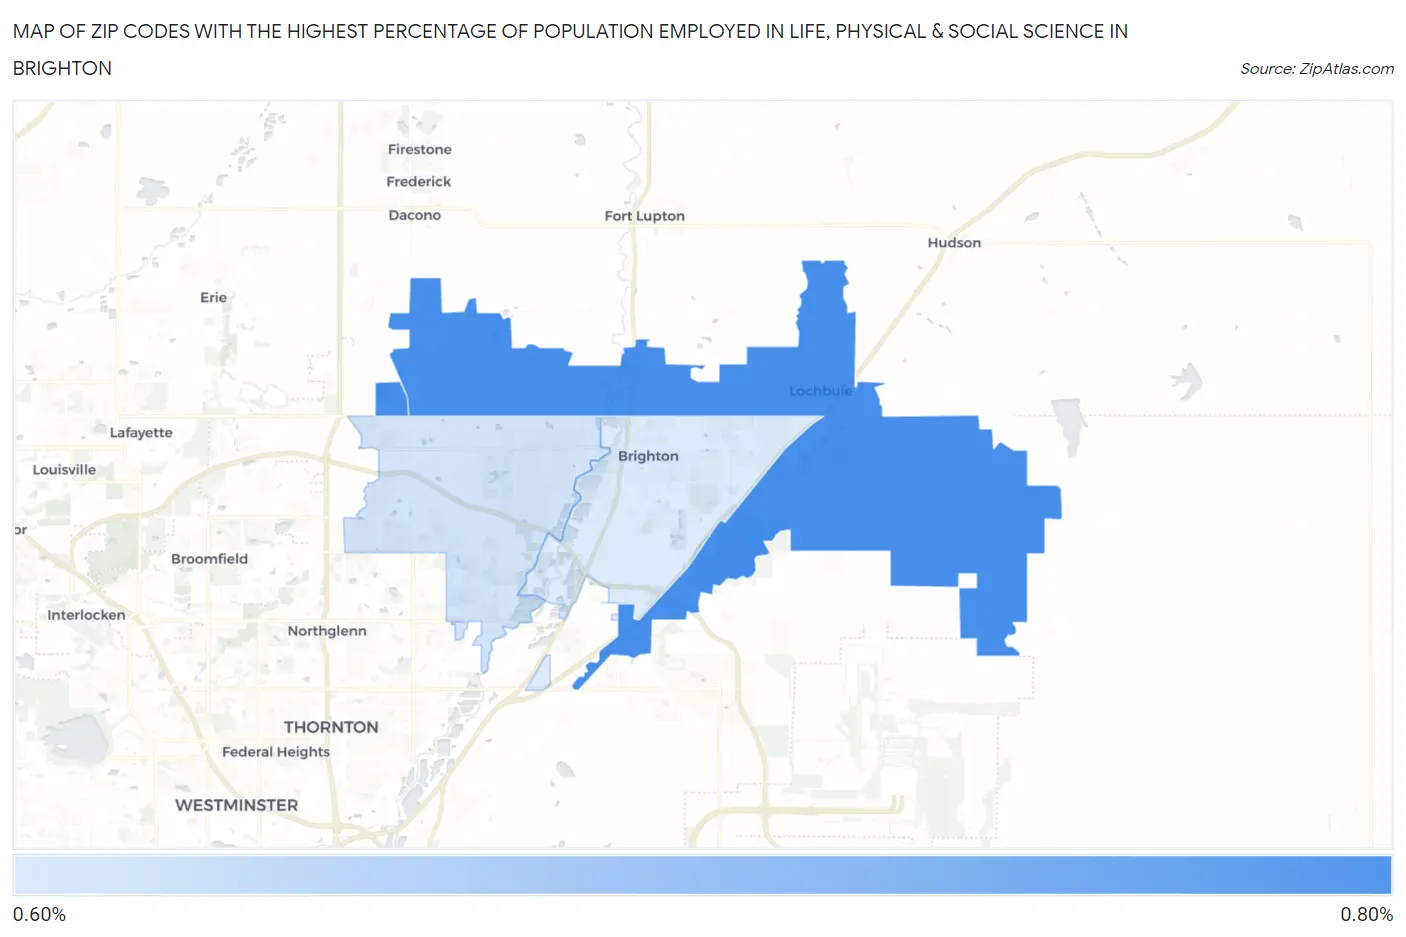
Map of Zip Codes with the Highest Percentage of Population Employed in Life, Physical & Social Science in Brighton
0.69%
0.78%
Zip Codes with the Highest Percentage of Population Employed in Life, Physical & Social Science in Brighton, CO
| Zip Code | % Employed | vs State | vs National | |
| 1. | 80603 | 0.78% | 1.3%(-0.538)#218 | 1.1%(-0.311)#11,187 |
| 2. | 80602 | 0.70% | 1.3%(-0.619)#231 | 1.1%(-0.392)#12,037 |
| 3. | 80601 | 0.69% | 1.3%(-0.625)#232 | 1.1%(-0.398)#12,118 |
1
Common Questions
What are the Top Zip Codes with the Highest Percentage of Population Employed in Life, Physical & Social Science in Brighton, CO?
Top Zip Codes with the Highest Percentage of Population Employed in Life, Physical & Social Science in Brighton, CO are:
What zip code has the Highest Percentage of Population Employed in Life, Physical & Social Science in Brighton, CO?
80603 has the Highest Percentage of Population Employed in Life, Physical & Social Science in Brighton, CO with 0.78%.
What is the Percentage of Population Employed in Life, Physical & Social Science in Brighton, CO?
Percentage of Population Employed in Life, Physical & Social Science in Brighton is 0.70%.
What is the Percentage of Population Employed in Life, Physical & Social Science in Colorado?
Percentage of Population Employed in Life, Physical & Social Science in Colorado is 1.3%.
What is the Percentage of Population Employed in Life, Physical & Social Science in the United States?
Percentage of Population Employed in Life, Physical & Social Science in the United States is 1.1%.