Zip Codes with the Highest Percentage of Households Heated by Bottled Gas / Liquid Propane in San Francisco, CA
RELATED REPORTS & OPTIONS
Bottled Gas / LP Heating
San Francisco
Compare Zip Codes
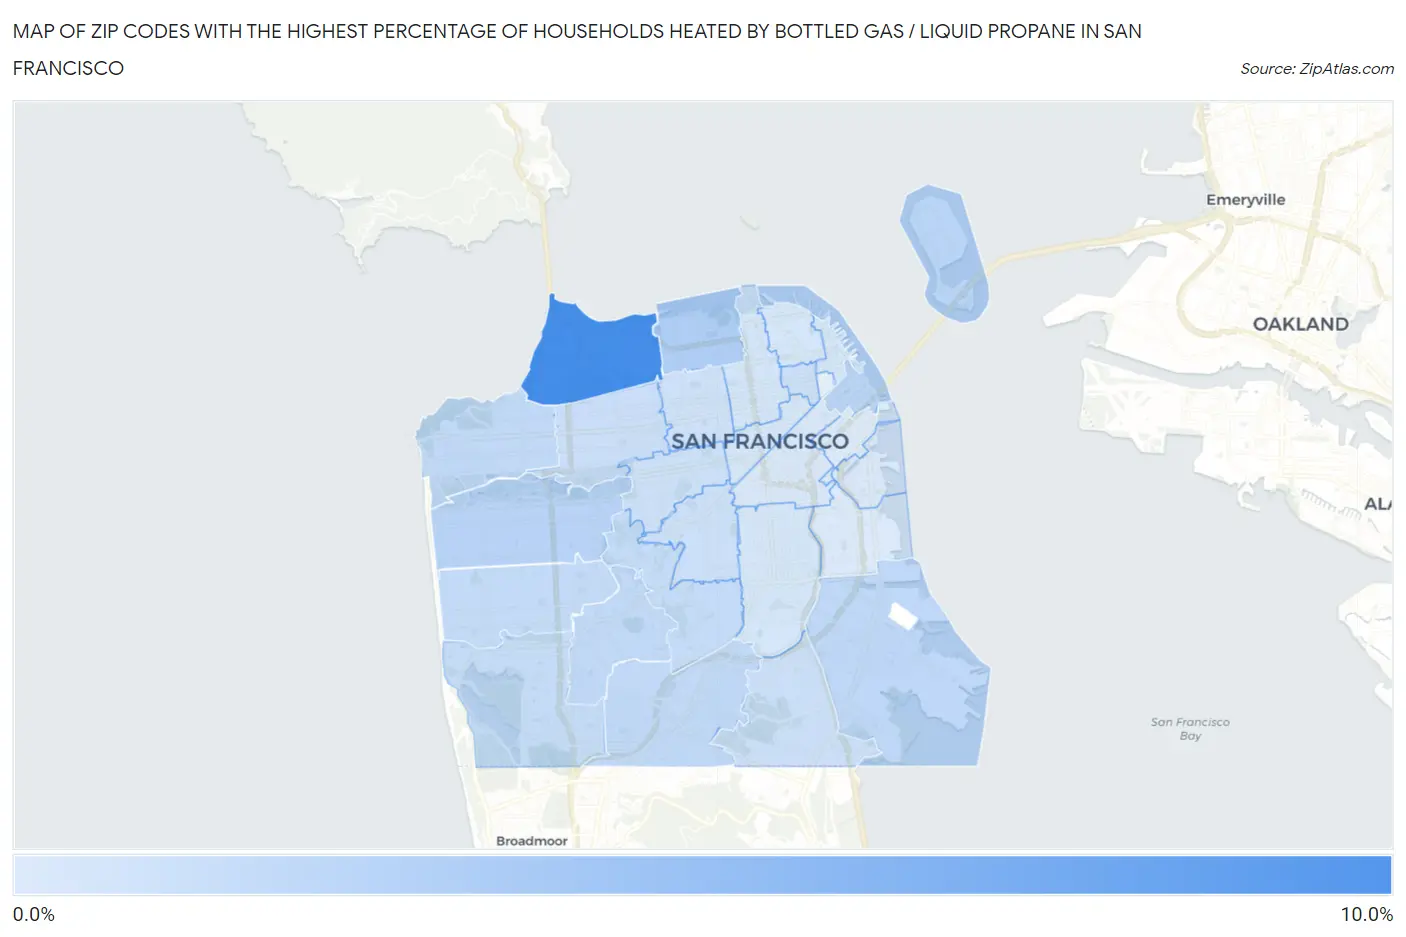
Map of Zip Codes with the Highest Percentage of Households Heated by Bottled Gas / Liquid Propane in San Francisco
0.60%
9.8%
Zip Codes with the Highest Percentage of Households Heated by Bottled Gas / Liquid Propane in San Francisco, CA
| Zip Code | Bottled Gas / LP Heating | vs State | vs National | |
| 1. | 94129 | 9.8% | 3.5%(+6.30)#496 | 4.9%(+4.90)#14,602 |
| 2. | 94123 | 3.3% | 3.5%(-0.200)#694 | 4.9%(-1.60)#20,547 |
| 3. | 94122 | 2.8% | 3.5%(-0.700)#736 | 4.9%(-2.10)#21,312 |
| 4. | 94105 | 2.6% | 3.5%(-0.900)#775 | 4.9%(-2.30)#21,788 |
| 5. | 94130 | 2.6% | 3.5%(-0.900)#778 | 4.9%(-2.30)#21,844 |
| 6. | 94124 | 2.4% | 3.5%(-1.10)#810 | 4.9%(-2.50)#22,142 |
| 7. | 94112 | 2.3% | 3.5%(-1.20)#827 | 4.9%(-2.60)#22,318 |
| 8. | 94121 | 2.3% | 3.5%(-1.20)#838 | 4.9%(-2.60)#22,354 |
| 9. | 94127 | 2.3% | 3.5%(-1.20)#851 | 4.9%(-2.60)#22,439 |
| 10. | 94116 | 2.1% | 3.5%(-1.40)#889 | 4.9%(-2.80)#22,829 |
| 11. | 94131 | 1.9% | 3.5%(-1.60)#982 | 4.9%(-3.00)#23,468 |
| 12. | 94132 | 1.9% | 3.5%(-1.60)#984 | 4.9%(-3.00)#23,474 |
| 13. | 94118 | 1.7% | 3.5%(-1.80)#1,051 | 4.9%(-3.20)#23,985 |
| 14. | 94134 | 1.6% | 3.5%(-1.90)#1,104 | 4.9%(-3.30)#24,323 |
| 15. | 94117 | 1.6% | 3.5%(-1.90)#1,106 | 4.9%(-3.30)#24,329 |
| 16. | 94108 | 1.6% | 3.5%(-1.90)#1,131 | 4.9%(-3.30)#24,489 |
| 17. | 94114 | 1.5% | 3.5%(-2.00)#1,156 | 4.9%(-3.40)#24,698 |
| 18. | 94115 | 1.4% | 3.5%(-2.10)#1,207 | 4.9%(-3.50)#25,077 |
| 19. | 94109 | 1.2% | 3.5%(-2.30)#1,287 | 4.9%(-3.70)#25,742 |
| 20. | 94111 | 1.2% | 3.5%(-2.30)#1,322 | 4.9%(-3.70)#26,058 |
| 21. | 94110 | 1.0% | 3.5%(-2.50)#1,384 | 4.9%(-3.90)#26,520 |
| 22. | 94102 | 1.0% | 3.5%(-2.50)#1,399 | 4.9%(-3.90)#26,627 |
| 23. | 94133 | 1.0% | 3.5%(-2.50)#1,410 | 4.9%(-3.90)#26,703 |
| 24. | 94103 | 0.90% | 3.5%(-2.60)#1,448 | 4.9%(-4.00)#27,070 |
| 25. | 94158 | 0.80% | 3.5%(-2.70)#1,502 | 4.9%(-4.10)#27,648 |
| 26. | 94107 | 0.60% | 3.5%(-2.90)#1,550 | 4.9%(-4.30)#28,232 |
1
Common Questions
What are the Top 10 Zip Codes with the Highest Percentage of Households Heated by Bottled Gas / Liquid Propane in San Francisco, CA?
Top 10 Zip Codes with the Highest Percentage of Households Heated by Bottled Gas / Liquid Propane in San Francisco, CA are:
What zip code has the Highest Percentage of Households Heated by Bottled Gas / Liquid Propane in San Francisco, CA?
94129 has the Highest Percentage of Households Heated by Bottled Gas / Liquid Propane in San Francisco, CA with 9.8%.
What is the Percentage of Households Heated by Bottled Gas / Liquid Propane in San Francisco, CA?
Percentage of Households Heated by Bottled Gas / Liquid Propane in San Francisco is 1.7%.
What is the Percentage of Households Heated by Bottled Gas / Liquid Propane in California?
Percentage of Households Heated by Bottled Gas / Liquid Propane in California is 3.5%.
What is the Percentage of Households Heated by Bottled Gas / Liquid Propane in the United States?
Percentage of Households Heated by Bottled Gas / Liquid Propane in the United States is 4.9%.