Zip Codes with the Highest Percentage of Households Without a Vehicle in District Of Columbia
RELATED REPORTS & OPTIONS
Households without a Cars
District Of Columbia
Compare Zip Codes
Map of Zip Codes with the Highest Percentage of Households Without a Vehicle in District Of Columbia
0.0%
100.0%
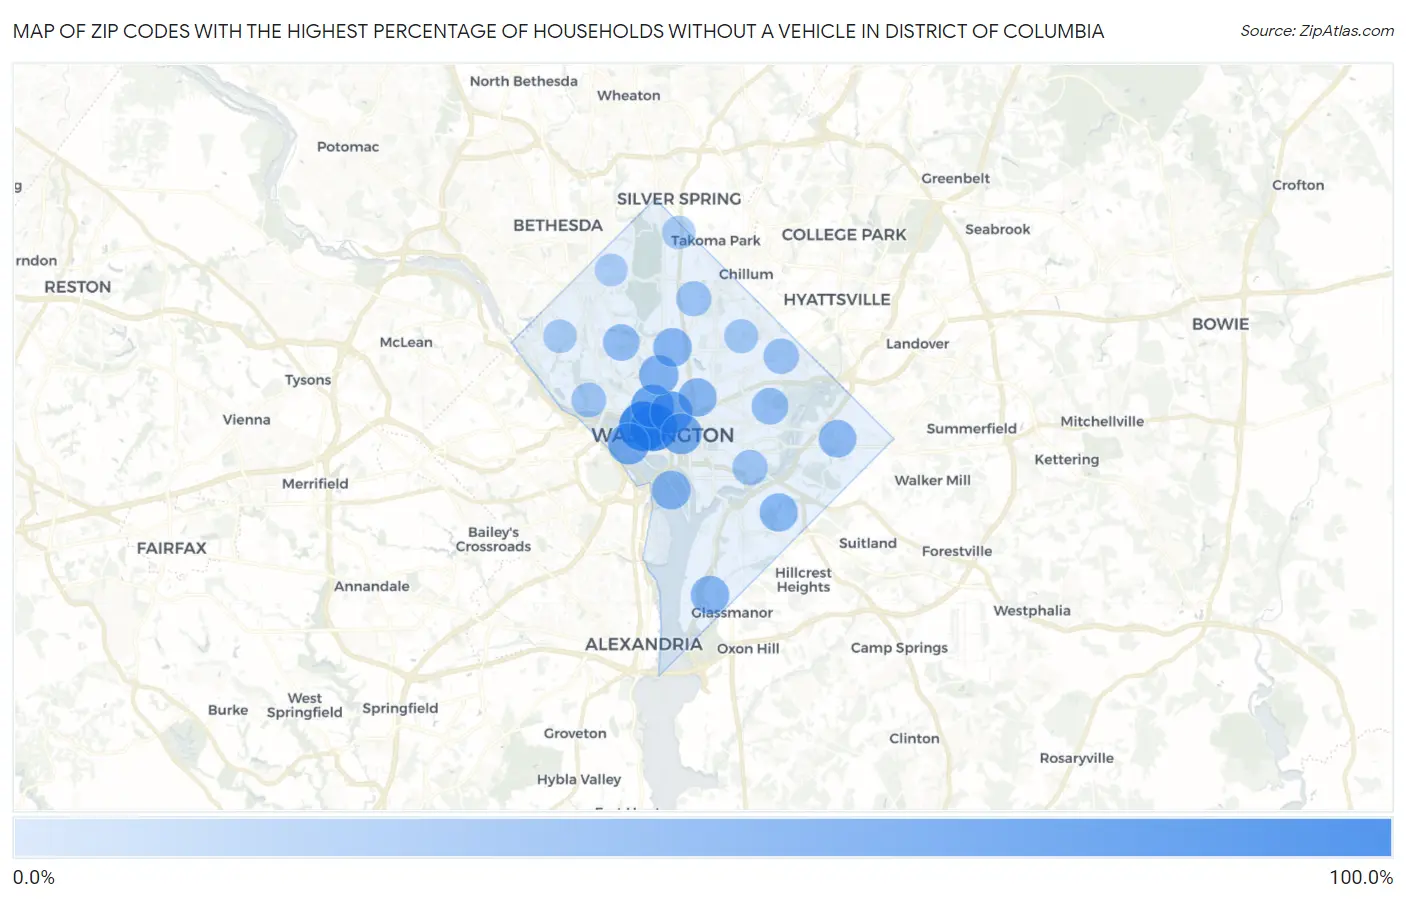
Zip Codes with the Highest Percentage of Households Without a Vehicle in District Of Columbia
| Zip Code | Housholds Without a Car | vs State | vs National | |
| 1. | 20052 | 100.0% | 35.7% (+64.3)#1 | 8.3% (+91.7)#9 |
| 2. | 20006 | 88.2% | 35.7% (+52.5)#2 | 8.3% (+79.9)#96 |
| 3. | 20036 | 65.2% | 35.7% (+29.5)#3 | 8.3% (+56.9)#236 |
| 4. | 20005 | 62.7% | 35.7% (+27.0)#4 | 8.3% (+54.4)#253 |
| 5. | 20037 | 57.4% | 35.7% (+21.7)#5 | 8.3% (+49.1)#285 |
| 6. | 20004 | 54.6% | 35.7% (+18.9)#6 | 8.3% (+46.3)#311 |
| 7. | 20009 | 48.2% | 35.7% (+12.5)#7 | 8.3% (+39.9)#361 |
| 8. | 20024 | 43.3% | 35.7% (+7.60)#8 | 8.3% (+35.0)#437 |
| 9. | 20010 | 42.7% | 35.7% (+7.00)#9 | 8.3% (+34.4)#458 |
| 10. | 20001 | 41.9% | 35.7% (+6.20)#10 | 8.3% (+33.6)#477 |
| 11. | 20032 | 41.8% | 35.7% (+6.10)#11 | 8.3% (+33.5)#480 |
| 12. | 20020 | 40.5% | 35.7% (+4.80)#12 | 8.3% (+32.2)#503 |
| 13. | 20019 | 37.7% | 35.7% (+2.00)#13 | 8.3% (+29.4)#566 |
| 14. | 20002 | 32.8% | 35.7% (-2.90)#14 | 8.3% (+24.5)#701 |
| 15. | 20008 | 32.4% | 35.7% (-3.30)#15 | 8.3% (+24.1)#713 |
| 16. | 20018 | 26.9% | 35.7% (-8.80)#16 | 8.3% (+18.6)#946 |
| 17. | 20003 | 25.9% | 35.7% (-9.80)#17 | 8.3% (+17.6)#1,005 |
| 18. | 20011 | 25.4% | 35.7% (-10.3)#18 | 8.3% (+17.1)#1,042 |
| 19. | 20007 | 23.1% | 35.7% (-12.6)#19 | 8.3% (+14.8)#1,205 |
| 20. | 20017 | 19.4% | 35.7% (-16.3)#20 | 8.3% (+11.1)#1,578 |
| 21. | 20016 | 17.2% | 35.7% (-18.5)#21 | 8.3% (+8.90)#1,912 |
| 22. | 20012 | 16.5% | 35.7% (-19.2)#22 | 8.3% (+8.20)#2,055 |
| 23. | 20015 | 13.0% | 35.7% (-22.7)#23 | 8.3% (+4.70)#3,094 |
1
Common Questions
What are the Top 10 Zip Codes with the Highest Percentage of Households Without a Vehicle in District Of Columbia?
Top 10 Zip Codes with the Highest Percentage of Households Without a Vehicle in District Of Columbia are:
What zip code has the Highest Percentage of Households Without a Vehicle in District Of Columbia?
20052 has the Highest Percentage of Households Without a Vehicle in District Of Columbia with 100.0%.
What is the Percentage of Households Without a Vehicle in the State of District Of Columbia?
Percentage of Households Without a Vehicle in District Of Columbia is 35.7%.
What is the Percentage of Households Without a Vehicle in the United States?
Percentage of Households Without a Vehicle in the United States is 8.3%.