Subsaharan African 1 or more Vehicles in Household
COMPARE
Subsaharan African
Select to Compare
1 or more Vehicles in Household
Subsaharan African 1 or more Vehicles in Household
87.9%
1+ VEHICLES AVAILABLE
0.5/ 100
METRIC RATING
262nd/ 347
METRIC RANK
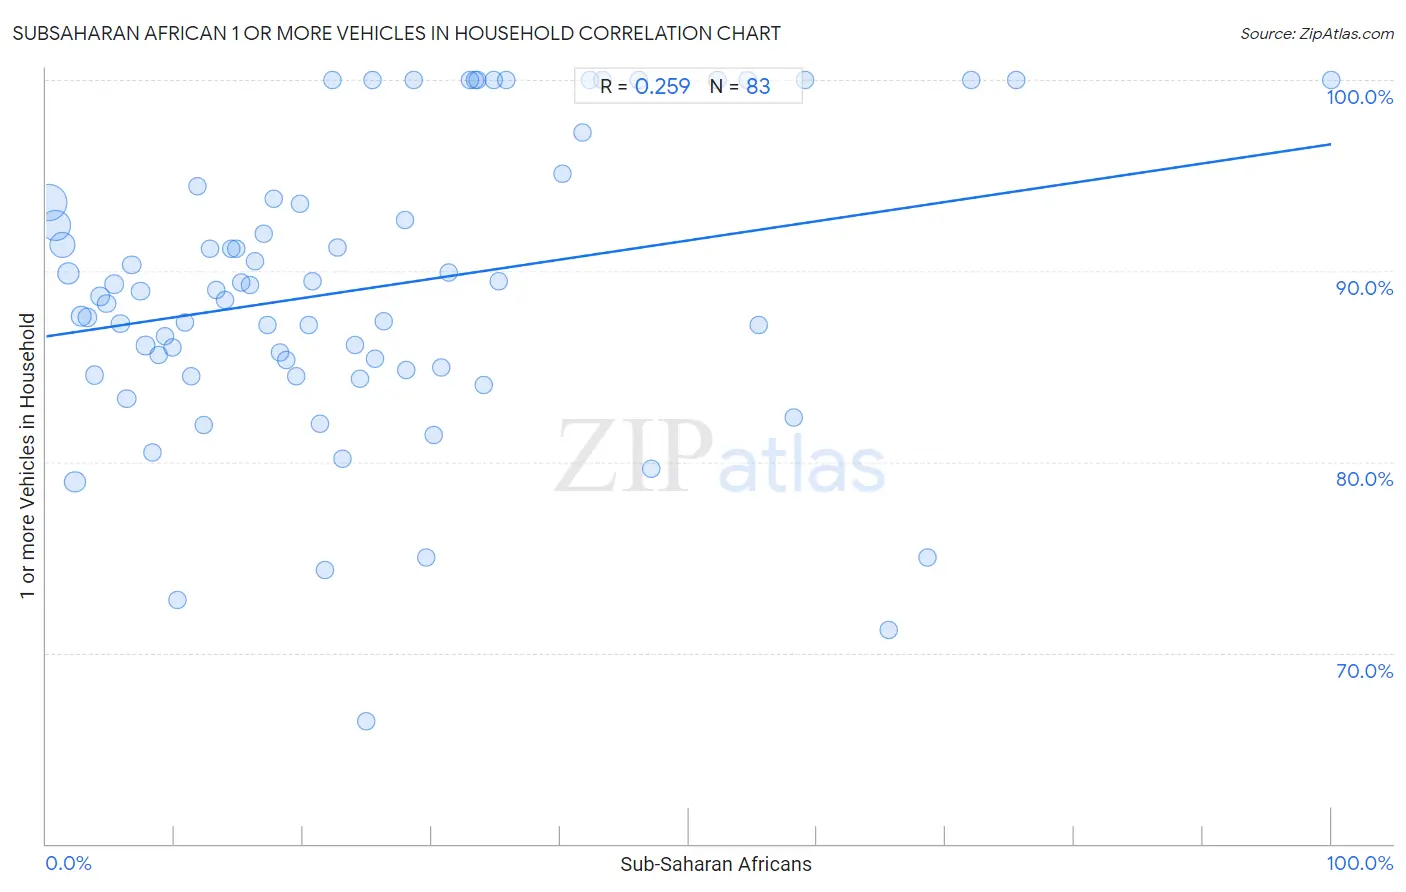
Subsaharan African 1 or more Vehicles in Household Correlation Chart
The statistical analysis conducted on geographies consisting of 507,682,612 people shows a weak positive correlation between the proportion of Sub-Saharan Africans and percentage of households with 1 or more vehicles available in the United States with a correlation coefficient (R) of 0.259 and weighted average of 87.9%. On average, for every 1% (one percent) increase in Sub-Saharan Africans within a typical geography, there is an increase of 0.10% in percentage of households with 1 or more vehicles available.
It is essential to understand that the correlation between the percentage of Sub-Saharan Africans and percentage of households with 1 or more vehicles available does not imply a direct cause-and-effect relationship. It remains uncertain whether the presence of Sub-Saharan Africans influences an upward or downward trend in the level of percentage of households with 1 or more vehicles available within an area, or if Sub-Saharan Africans simply ended up residing in those areas with higher or lower levels of percentage of households with 1 or more vehicles available due to other factors.
Demographics Similar to Sub-Saharan Africans by 1 or more Vehicles in Household
In terms of 1 or more vehicles in household, the demographic groups most similar to Sub-Saharan Africans are Immigrants from Switzerland (87.9%, a difference of 0.030%), Macedonian (87.9%, a difference of 0.070%), Immigrants from Egypt (87.8%, a difference of 0.070%), Immigrants from Liberia (87.8%, a difference of 0.080%), and African (87.8%, a difference of 0.11%).
| Demographics | Rating | Rank | 1 or more Vehicles in Household |
| Immigrants from Latvia | 0.9 /100 | #255 | Tragic 88.1% |
| Colombians | 0.9 /100 | #256 | Tragic 88.0% |
| Liberians | 0.9 /100 | #257 | Tragic 88.0% |
| South American Indians | 0.9 /100 | #258 | Tragic 88.0% |
| Nigerians | 0.8 /100 | #259 | Tragic 88.0% |
| Macedonians | 0.6 /100 | #260 | Tragic 87.9% |
| Immigrants from Switzerland | 0.6 /100 | #261 | Tragic 87.9% |
| Sub-Saharan Africans | 0.5 /100 | #262 | Tragic 87.9% |
| Immigrants from Egypt | 0.5 /100 | #263 | Tragic 87.8% |
| Immigrants from Liberia | 0.4 /100 | #264 | Tragic 87.8% |
| Africans | 0.4 /100 | #265 | Tragic 87.8% |
| Israelis | 0.3 /100 | #266 | Tragic 87.7% |
| Immigrants from Colombia | 0.3 /100 | #267 | Tragic 87.6% |
| Immigrants from Europe | 0.2 /100 | #268 | Tragic 87.6% |
| Immigrants from Africa | 0.2 /100 | #269 | Tragic 87.6% |
Subsaharan African 1 or more Vehicles in Household Correlation Summary
| Measurement | Subsaharan African Data | 1 or more Vehicles in Household Data |
| Minimum | 0.24% | 66.4% |
| Maximum | 100.0% | 100.0% |
| Range | 99.8% | 33.6% |
| Mean | 25.0% | 89.1% |
| Median | 20.7% | 89.0% |
| Interquartile 25% (IQ1) | 10.2% | 84.8% |
| Interquartile 75% (IQ3) | 33.5% | 93.8% |
| Interquartile Range (IQR) | 23.3% | 9.0% |
| Standard Deviation (Sample) | 19.7% | 7.7% |
| Standard Deviation (Population) | 19.6% | 7.6% |
Correlation Details
| Subsaharan African Percentile | Sample Size | 1 or more Vehicles in Household |
[ 0.0% - 0.5% ] 0.24% | 172,365,191 | 93.6% |
[ 0.5% - 1.0% ] 0.72% | 106,925,949 | 92.4% |
[ 1.0% - 1.5% ] 1.24% | 70,654,406 | 91.4% |
[ 1.5% - 2.0% ] 1.73% | 41,234,739 | 89.9% |
[ 2.0% - 2.5% ] 2.25% | 34,279,559 | 79.0% |
[ 2.5% - 3.0% ] 2.73% | 23,398,646 | 87.7% |
[ 3.0% - 3.5% ] 3.23% | 13,225,936 | 87.6% |
[ 3.5% - 4.0% ] 3.75% | 9,297,218 | 84.5% |
[ 4.0% - 4.5% ] 4.22% | 8,854,816 | 88.6% |
[ 4.5% - 5.0% ] 4.71% | 4,060,785 | 88.3% |
[ 5.0% - 5.5% ] 5.29% | 3,775,169 | 89.3% |
[ 5.5% - 6.0% ] 5.77% | 3,290,702 | 87.2% |
[ 6.0% - 6.5% ] 6.26% | 2,200,977 | 83.3% |
[ 6.5% - 7.0% ] 6.66% | 2,516,365 | 90.3% |
[ 7.0% - 7.5% ] 7.34% | 1,485,697 | 89.0% |
[ 7.5% - 8.0% ] 7.73% | 1,549,290 | 86.1% |
[ 8.0% - 8.5% ] 8.23% | 991,101 | 80.5% |
[ 8.5% - 9.0% ] 8.72% | 992,684 | 85.6% |
[ 9.0% - 9.5% ] 9.27% | 866,189 | 86.6% |
[ 9.5% - 10.0% ] 9.78% | 413,452 | 86.0% |
[ 10.0% - 10.5% ] 10.22% | 753,710 | 72.8% |
[ 10.5% - 11.0% ] 10.78% | 529,116 | 87.3% |
[ 11.0% - 11.5% ] 11.27% | 653,154 | 84.5% |
[ 11.5% - 12.0% ] 11.75% | 279,205 | 94.4% |
[ 12.0% - 12.5% ] 12.27% | 101,251 | 81.9% |
[ 12.5% - 13.0% ] 12.77% | 185,037 | 91.2% |
[ 13.0% - 13.5% ] 13.23% | 438,997 | 89.0% |
[ 13.5% - 14.0% ] 13.91% | 351,481 | 88.5% |
[ 14.0% - 14.5% ] 14.38% | 83,868 | 91.2% |
[ 14.5% - 15.0% ] 14.81% | 134,736 | 91.1% |
[ 15.0% - 15.5% ] 15.22% | 236,677 | 89.4% |
[ 15.5% - 16.0% ] 15.84% | 217,889 | 89.3% |
[ 16.0% - 16.5% ] 16.25% | 194,496 | 90.5% |
[ 16.5% - 17.0% ] 16.91% | 30,595 | 92.0% |
[ 17.0% - 17.5% ] 17.26% | 146,055 | 87.2% |
[ 17.5% - 18.0% ] 17.73% | 65,973 | 93.8% |
[ 18.0% - 18.5% ] 18.20% | 221,308 | 85.7% |
[ 18.5% - 19.0% ] 18.66% | 97,301 | 85.4% |
[ 19.0% - 19.5% ] 19.43% | 243,526 | 84.5% |
[ 19.5% - 20.0% ] 19.74% | 20,175 | 93.5% |
[ 20.0% - 20.5% ] 20.40% | 38,685 | 87.2% |
[ 20.5% - 21.0% ] 20.73% | 34,831 | 89.4% |
[ 21.0% - 21.5% ] 21.30% | 28,219 | 82.0% |
[ 21.5% - 22.0% ] 21.65% | 54,524 | 74.4% |
[ 22.0% - 22.5% ] 22.26% | 283 | 100.0% |
[ 22.5% - 23.0% ] 22.71% | 52,239 | 91.2% |
[ 23.0% - 23.5% ] 23.08% | 208 | 80.2% |
[ 23.5% - 24.0% ] 23.99% | 14,696 | 86.1% |
[ 24.0% - 24.5% ] 24.43% | 25,523 | 84.4% |
[ 24.5% - 25.0% ] 24.86% | 370 | 66.4% |
[ 25.0% - 25.5% ] 25.38% | 658 | 100.0% |
[ 25.5% - 26.0% ] 25.54% | 881 | 85.4% |
[ 26.0% - 26.5% ] 26.24% | 2,138 | 87.3% |
[ 27.5% - 28.0% ] 27.93% | 512 | 92.6% |
[ 28.0% - 28.5% ] 28.06% | 29,898 | 84.8% |
[ 28.5% - 29.0% ] 28.57% | 154 | 100.0% |
[ 29.5% - 30.0% ] 29.55% | 44 | 75.0% |
[ 30.0% - 30.5% ] 30.14% | 2,037 | 81.4% |
[ 30.5% - 31.0% ] 30.74% | 15,489 | 85.0% |
[ 31.0% - 31.5% ] 31.35% | 2,485 | 89.9% |
[ 32.5% - 33.0% ] 32.93% | 334 | 100.0% |
[ 33.0% - 33.5% ] 33.33% | 39 | 100.0% |
[ 33.5% - 34.0% ] 33.53% | 173 | 100.0% |
[ 34.0% - 34.5% ] 34.07% | 3,824 | 84.0% |
[ 34.5% - 35.0% ] 34.78% | 46 | 100.0% |
[ 35.0% - 35.5% ] 35.23% | 1,286 | 89.5% |
[ 35.5% - 36.0% ] 35.82% | 67 | 100.0% |
[ 40.0% - 40.5% ] 40.22% | 4,572 | 95.1% |
[ 41.5% - 42.0% ] 41.76% | 613 | 97.3% |
[ 42.0% - 42.5% ] 42.31% | 338 | 100.0% |
[ 43.0% - 43.5% ] 43.29% | 633 | 100.0% |
[ 46.0% - 46.5% ] 46.15% | 78 | 100.0% |
[ 47.0% - 47.5% ] 47.10% | 1,157 | 79.6% |
[ 52.0% - 52.5% ] 52.27% | 88 | 100.0% |
[ 54.5% - 55.0% ] 54.55% | 11 | 100.0% |
[ 55.0% - 55.5% ] 55.41% | 231 | 87.1% |
[ 58.0% - 58.5% ] 58.19% | 574 | 82.3% |
[ 59.0% - 59.5% ] 59.02% | 549 | 100.0% |
[ 65.5% - 66.0% ] 65.55% | 479 | 71.2% |
[ 68.5% - 69.0% ] 68.60% | 86 | 75.0% |
[ 72.0% - 72.5% ] 72.00% | 50 | 100.0% |
[ 75.0% - 75.5% ] 75.44% | 57 | 100.0% |
[ 99.5% - 100.0% ] 100.00% | 32 | 100.0% |