Jamaican 1 or more Vehicles in Household
COMPARE
Jamaican
Select to Compare
1 or more Vehicles in Household
Jamaican 1 or more Vehicles in Household
82.1%
1+ VEHICLES AVAILABLE
0.0/ 100
METRIC RATING
321st/ 347
METRIC RANK
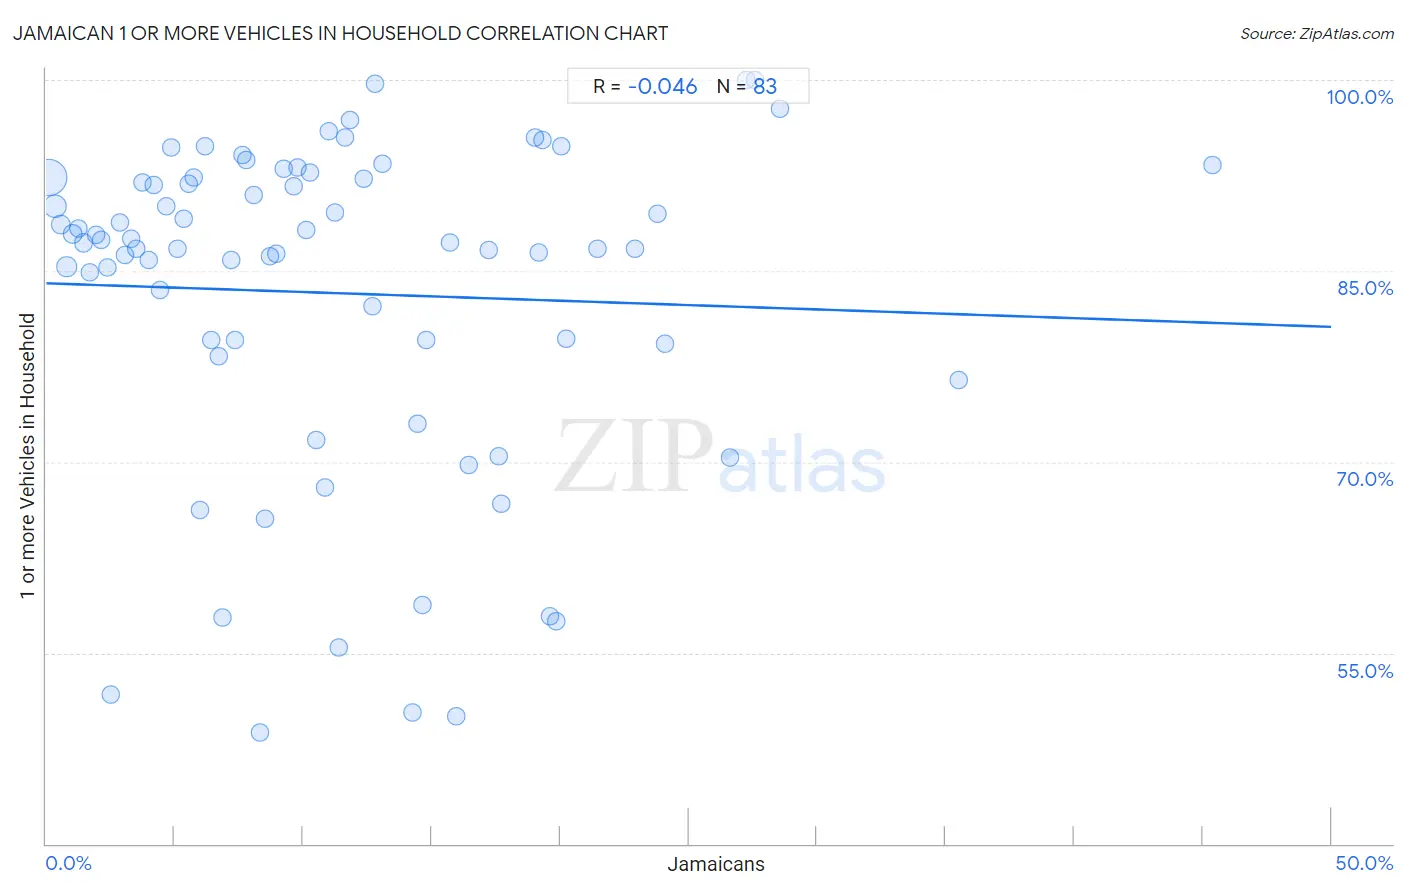
Jamaican 1 or more Vehicles in Household Correlation Chart
The statistical analysis conducted on geographies consisting of 367,719,271 people shows no correlation between the proportion of Jamaicans and percentage of households with 1 or more vehicles available in the United States with a correlation coefficient (R) of -0.046 and weighted average of 82.1%. On average, for every 1% (one percent) increase in Jamaicans within a typical geography, there is a decrease of 0.069% in percentage of households with 1 or more vehicles available.
It is essential to understand that the correlation between the percentage of Jamaicans and percentage of households with 1 or more vehicles available does not imply a direct cause-and-effect relationship. It remains uncertain whether the presence of Jamaicans influences an upward or downward trend in the level of percentage of households with 1 or more vehicles available within an area, or if Jamaicans simply ended up residing in those areas with higher or lower levels of percentage of households with 1 or more vehicles available due to other factors.
Demographics Similar to Jamaicans by 1 or more Vehicles in Household
In terms of 1 or more vehicles in household, the demographic groups most similar to Jamaicans are Soviet Union (82.7%, a difference of 0.64%), Immigrants from Cabo Verde (81.6%, a difference of 0.67%), Immigrants from Belarus (83.3%, a difference of 1.5%), Immigrants from Ghana (83.4%, a difference of 1.6%), and Ghanaian (83.6%, a difference of 1.8%).
| Demographics | Rating | Rank | 1 or more Vehicles in Household |
| Albanians | 0.0 /100 | #314 | Tragic 84.4% |
| Cypriots | 0.0 /100 | #315 | Tragic 84.4% |
| Alaska Natives | 0.0 /100 | #316 | Tragic 83.8% |
| Ghanaians | 0.0 /100 | #317 | Tragic 83.6% |
| Immigrants from Ghana | 0.0 /100 | #318 | Tragic 83.4% |
| Immigrants from Belarus | 0.0 /100 | #319 | Tragic 83.3% |
| Soviet Union | 0.0 /100 | #320 | Tragic 82.7% |
| Jamaicans | 0.0 /100 | #321 | Tragic 82.1% |
| Immigrants from Cabo Verde | 0.0 /100 | #322 | Tragic 81.6% |
| Immigrants from Yemen | 0.0 /100 | #323 | Tragic 80.5% |
| Immigrants from Caribbean | 0.0 /100 | #324 | Tragic 80.4% |
| Senegalese | 0.0 /100 | #325 | Tragic 80.4% |
| Immigrants from West Indies | 0.0 /100 | #326 | Tragic 79.5% |
| Immigrants from Senegal | 0.0 /100 | #327 | Tragic 79.0% |
| Ecuadorians | 0.0 /100 | #328 | Tragic 77.9% |
Jamaican 1 or more Vehicles in Household Correlation Summary
| Measurement | Jamaican Data | 1 or more Vehicles in Household Data |
| Minimum | 0.098% | 48.7% |
| Maximum | 45.4% | 100.0% |
| Range | 45.3% | 51.3% |
| Mean | 11.3% | 83.3% |
| Median | 9.6% | 87.2% |
| Interquartile 25% (IQ1) | 4.7% | 79.3% |
| Interquartile 75% (IQ3) | 16.4% | 92.3% |
| Interquartile Range (IQR) | 11.8% | 13.0% |
| Standard Deviation (Sample) | 8.7% | 13.0% |
| Standard Deviation (Population) | 8.6% | 12.9% |
Correlation Details
| Jamaican Percentile | Sample Size | 1 or more Vehicles in Household |
[ 0.0% - 0.5% ] 0.098% | 212,806,819 | 92.3% |
[ 0.0% - 0.5% ] 0.32% | 56,725,348 | 90.1% |
[ 0.5% - 1.0% ] 0.57% | 24,407,412 | 88.7% |
[ 0.5% - 1.0% ] 0.79% | 17,466,968 | 85.3% |
[ 1.0% - 1.5% ] 1.02% | 10,150,722 | 87.9% |
[ 1.0% - 1.5% ] 1.24% | 6,747,564 | 88.3% |
[ 1.0% - 1.5% ] 1.46% | 5,427,334 | 87.2% |
[ 1.5% - 2.0% ] 1.71% | 3,895,647 | 84.9% |
[ 1.5% - 2.0% ] 1.93% | 3,082,257 | 87.8% |
[ 2.0% - 2.5% ] 2.15% | 2,524,317 | 87.4% |
[ 2.0% - 2.5% ] 2.40% | 1,275,900 | 85.3% |
[ 2.5% - 3.0% ] 2.52% | 10,260,437 | 51.7% |
[ 2.5% - 3.0% ] 2.85% | 926,382 | 88.8% |
[ 3.0% - 3.5% ] 3.04% | 1,386,713 | 86.2% |
[ 3.0% - 3.5% ] 3.32% | 1,264,004 | 87.5% |
[ 3.5% - 4.0% ] 3.52% | 632,497 | 86.7% |
[ 3.5% - 4.0% ] 3.77% | 666,159 | 92.0% |
[ 3.5% - 4.0% ] 3.98% | 511,884 | 85.8% |
[ 4.0% - 4.5% ] 4.16% | 340,210 | 91.8% |
[ 4.0% - 4.5% ] 4.44% | 584,124 | 83.5% |
[ 4.5% - 5.0% ] 4.65% | 540,500 | 90.1% |
[ 4.5% - 5.0% ] 4.85% | 417,036 | 94.7% |
[ 5.0% - 5.5% ] 5.10% | 153,077 | 86.8% |
[ 5.0% - 5.5% ] 5.35% | 201,661 | 89.1% |
[ 5.5% - 6.0% ] 5.56% | 311,925 | 91.9% |
[ 5.5% - 6.0% ] 5.75% | 370,061 | 92.3% |
[ 6.0% - 6.5% ] 6.00% | 358,301 | 66.2% |
[ 6.0% - 6.5% ] 6.19% | 67,502 | 94.8% |
[ 6.0% - 6.5% ] 6.43% | 183,080 | 79.5% |
[ 6.5% - 7.0% ] 6.69% | 427,938 | 78.3% |
[ 6.5% - 7.0% ] 6.86% | 156,040 | 57.7% |
[ 7.0% - 7.5% ] 7.20% | 346,080 | 85.8% |
[ 7.0% - 7.5% ] 7.33% | 140,396 | 79.6% |
[ 7.5% - 8.0% ] 7.62% | 7,365 | 94.1% |
[ 7.5% - 8.0% ] 7.80% | 162,063 | 93.7% |
[ 8.0% - 8.5% ] 8.09% | 150,471 | 90.9% |
[ 8.0% - 8.5% ] 8.33% | 138,522 | 48.7% |
[ 8.0% - 8.5% ] 8.49% | 197,052 | 65.5% |
[ 8.5% - 9.0% ] 8.69% | 101,391 | 86.2% |
[ 8.5% - 9.0% ] 8.96% | 154,467 | 86.4% |
[ 9.0% - 9.5% ] 9.25% | 40,619 | 93.0% |
[ 9.5% - 10.0% ] 9.64% | 43,733 | 91.6% |
[ 9.5% - 10.0% ] 9.78% | 139,481 | 93.1% |
[ 10.0% - 10.5% ] 10.13% | 81,502 | 88.2% |
[ 10.0% - 10.5% ] 10.28% | 63,088 | 92.7% |
[ 10.5% - 11.0% ] 10.51% | 124,075 | 71.7% |
[ 10.5% - 11.0% ] 10.84% | 39,495 | 68.0% |
[ 10.5% - 11.0% ] 10.99% | 74,916 | 96.0% |
[ 11.0% - 11.5% ] 11.24% | 94,486 | 89.6% |
[ 11.0% - 11.5% ] 11.38% | 43,517 | 55.5% |
[ 11.5% - 12.0% ] 11.64% | 739 | 95.5% |
[ 11.5% - 12.0% ] 11.84% | 135,158 | 96.9% |
[ 12.0% - 12.5% ] 12.38% | 80,728 | 92.3% |
[ 12.5% - 13.0% ] 12.70% | 14,549 | 82.2% |
[ 12.5% - 13.0% ] 12.81% | 640 | 99.7% |
[ 13.0% - 13.5% ] 13.08% | 3,571 | 93.4% |
[ 14.0% - 14.5% ] 14.23% | 78,506 | 50.3% |
[ 14.0% - 14.5% ] 14.45% | 68,431 | 73.0% |
[ 14.5% - 15.0% ] 14.65% | 13,479 | 58.8% |
[ 14.5% - 15.0% ] 14.77% | 27,845 | 79.6% |
[ 15.5% - 16.0% ] 15.69% | 2,039 | 87.2% |
[ 15.5% - 16.0% ] 15.95% | 163 | 50.0% |
[ 16.0% - 16.5% ] 16.43% | 121,912 | 69.8% |
[ 17.0% - 17.5% ] 17.21% | 22,486 | 86.6% |
[ 17.5% - 18.0% ] 17.62% | 104,158 | 70.4% |
[ 17.5% - 18.0% ] 17.71% | 72,817 | 66.7% |
[ 19.0% - 19.5% ] 19.03% | 310 | 95.5% |
[ 19.0% - 19.5% ] 19.16% | 62,232 | 86.4% |
[ 19.0% - 19.5% ] 19.31% | 47,516 | 95.3% |
[ 19.5% - 20.0% ] 19.62% | 40,073 | 57.9% |
[ 19.5% - 20.0% ] 19.85% | 72,581 | 57.5% |
[ 20.0% - 20.5% ] 20.02% | 52,792 | 94.8% |
[ 20.0% - 20.5% ] 20.24% | 40,672 | 79.7% |
[ 21.0% - 21.5% ] 21.47% | 35,914 | 86.8% |
[ 22.5% - 23.0% ] 22.90% | 118,819 | 86.7% |
[ 23.5% - 24.0% ] 23.79% | 52,000 | 89.4% |
[ 24.0% - 24.5% ] 24.06% | 10,526 | 79.3% |
[ 26.5% - 27.0% ] 26.59% | 21,977 | 70.3% |
[ 27.0% - 27.5% ] 27.26% | 543 | 100.0% |
[ 27.5% - 28.0% ] 27.58% | 562 | 100.0% |
[ 28.5% - 29.0% ] 28.55% | 641 | 97.7% |
[ 35.5% - 36.0% ] 35.52% | 2,224 | 76.5% |
[ 45.0% - 45.5% ] 45.38% | 130 | 93.3% |