Immigrants from Oceania 1 or more Vehicles in Household
COMPARE
Immigrants from Oceania
Select to Compare
1 or more Vehicles in Household
Immigrants from Oceania 1 or more Vehicles in Household
90.4%
1+ VEHICLES AVAILABLE
86.9/ 100
METRIC RATING
135th/ 347
METRIC RANK
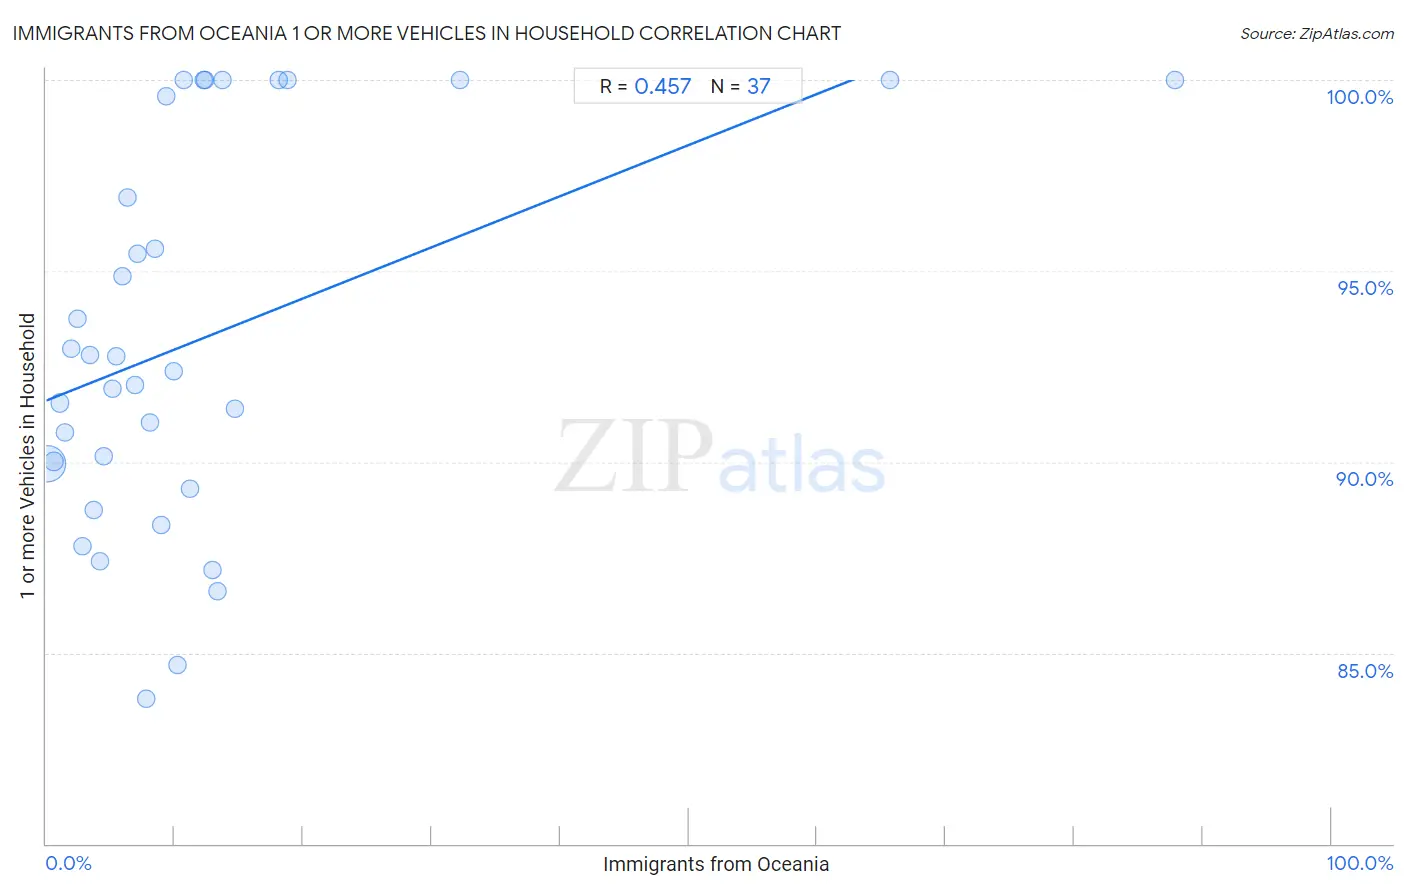
Immigrants from Oceania 1 or more Vehicles in Household Correlation Chart
The statistical analysis conducted on geographies consisting of 305,395,029 people shows a moderate positive correlation between the proportion of Immigrants from Oceania and percentage of households with 1 or more vehicles available in the United States with a correlation coefficient (R) of 0.457 and weighted average of 90.4%. On average, for every 1% (one percent) increase in Immigrants from Oceania within a typical geography, there is an increase of 0.13% in percentage of households with 1 or more vehicles available.
It is essential to understand that the correlation between the percentage of Immigrants from Oceania and percentage of households with 1 or more vehicles available does not imply a direct cause-and-effect relationship. It remains uncertain whether the presence of Immigrants from Oceania influences an upward or downward trend in the level of percentage of households with 1 or more vehicles available within an area, or if Immigrants from Oceania simply ended up residing in those areas with higher or lower levels of percentage of households with 1 or more vehicles available due to other factors.
Demographics Similar to Immigrants from Oceania by 1 or more Vehicles in Household
In terms of 1 or more vehicles in household, the demographic groups most similar to Immigrants from Oceania are Kenyan (90.4%, a difference of 0.0%), Immigrants from Syria (90.4%, a difference of 0.020%), Hungarian (90.3%, a difference of 0.020%), Latvian (90.3%, a difference of 0.020%), and Syrian (90.3%, a difference of 0.020%).
| Demographics | Rating | Rank | 1 or more Vehicles in Household |
| Burmese | 89.0 /100 | #128 | Excellent 90.4% |
| Marshallese | 88.9 /100 | #129 | Excellent 90.4% |
| Nicaraguans | 88.8 /100 | #130 | Excellent 90.4% |
| Immigrants from Kenya | 88.5 /100 | #131 | Excellent 90.4% |
| Immigrants from South Africa | 88.1 /100 | #132 | Excellent 90.4% |
| Immigrants from Syria | 87.5 /100 | #133 | Excellent 90.4% |
| Kenyans | 87.0 /100 | #134 | Excellent 90.4% |
| Immigrants from Oceania | 86.9 /100 | #135 | Excellent 90.4% |
| Hungarians | 86.5 /100 | #136 | Excellent 90.3% |
| Latvians | 86.3 /100 | #137 | Excellent 90.3% |
| Syrians | 86.3 /100 | #138 | Excellent 90.3% |
| Estonians | 85.6 /100 | #139 | Excellent 90.3% |
| Sudanese | 85.2 /100 | #140 | Excellent 90.3% |
| Immigrants from Moldova | 83.1 /100 | #141 | Excellent 90.2% |
| Immigrants from Lithuania | 83.0 /100 | #142 | Excellent 90.2% |
Immigrants from Oceania 1 or more Vehicles in Household Correlation Summary
| Measurement | Immigrants from Oceania Data | 1 or more Vehicles in Household Data |
| Minimum | 0.11% | 83.8% |
| Maximum | 87.8% | 100.0% |
| Range | 87.7% | 16.2% |
| Mean | 12.1% | 93.2% |
| Median | 8.1% | 92.4% |
| Interquartile 25% (IQ1) | 3.9% | 89.6% |
| Interquartile 75% (IQ3) | 12.6% | 99.8% |
| Interquartile Range (IQR) | 8.7% | 10.2% |
| Standard Deviation (Sample) | 17.0% | 5.0% |
| Standard Deviation (Population) | 16.8% | 4.9% |
Correlation Details
| Immigrants from Oceania Percentile | Sample Size | 1 or more Vehicles in Household |
[ 0.0% - 0.5% ] 0.11% | 281,212,156 | 90.0% |
[ 0.5% - 1.0% ] 0.60% | 14,196,922 | 90.0% |
[ 1.0% - 1.5% ] 1.06% | 4,767,658 | 91.5% |
[ 1.0% - 1.5% ] 1.49% | 2,249,425 | 90.8% |
[ 1.5% - 2.0% ] 1.97% | 825,521 | 93.0% |
[ 2.0% - 2.5% ] 2.42% | 510,963 | 93.8% |
[ 2.5% - 3.0% ] 2.84% | 636,165 | 87.8% |
[ 3.0% - 3.5% ] 3.36% | 184,131 | 92.8% |
[ 3.5% - 4.0% ] 3.65% | 261,846 | 88.7% |
[ 4.0% - 4.5% ] 4.16% | 83,227 | 87.4% |
[ 4.0% - 4.5% ] 4.50% | 81,303 | 90.1% |
[ 5.0% - 5.5% ] 5.17% | 208,937 | 91.9% |
[ 5.0% - 5.5% ] 5.43% | 42,814 | 92.8% |
[ 5.5% - 6.0% ] 5.89% | 4,433 | 94.8% |
[ 6.0% - 6.5% ] 6.32% | 6,901 | 96.9% |
[ 6.5% - 7.0% ] 6.93% | 5,914 | 92.0% |
[ 7.0% - 7.5% ] 7.12% | 63,455 | 95.5% |
[ 7.5% - 8.0% ] 7.82% | 15,342 | 83.8% |
[ 8.0% - 8.5% ] 8.06% | 7,392 | 91.0% |
[ 8.0% - 8.5% ] 8.45% | 5,221 | 95.6% |
[ 8.5% - 9.0% ] 8.97% | 624 | 88.4% |
[ 9.0% - 9.5% ] 9.32% | 719 | 99.6% |
[ 9.5% - 10.0% ] 9.89% | 2,174 | 92.4% |
[ 10.0% - 10.5% ] 10.25% | 4,185 | 84.7% |
[ 10.5% - 11.0% ] 10.67% | 1,059 | 100.0% |
[ 11.0% - 11.5% ] 11.19% | 1,858 | 89.3% |
[ 12.0% - 12.5% ] 12.26% | 212 | 100.0% |
[ 12.0% - 12.5% ] 12.33% | 73 | 100.0% |
[ 12.5% - 13.0% ] 12.94% | 7,236 | 87.2% |
[ 13.0% - 13.5% ] 13.36% | 5,411 | 86.6% |
[ 13.5% - 14.0% ] 13.73% | 102 | 100.0% |
[ 14.5% - 15.0% ] 14.65% | 198 | 91.4% |
[ 18.0% - 18.5% ] 18.09% | 188 | 100.0% |
[ 18.5% - 19.0% ] 18.76% | 693 | 100.0% |
[ 32.0% - 32.5% ] 32.16% | 398 | 100.0% |
[ 65.5% - 66.0% ] 65.66% | 99 | 100.0% |
[ 87.5% - 88.0% ] 87.84% | 74 | 100.0% |