Subsaharan African College, 1 year or more
COMPARE
Subsaharan African
Select to Compare
College, 1 year or more
Subsaharan African College, 1 year or more
57.3%
COLLEGE, 1 YEAR OR MORE
6.1/ 100
METRIC RATING
222nd/ 347
METRIC RANK
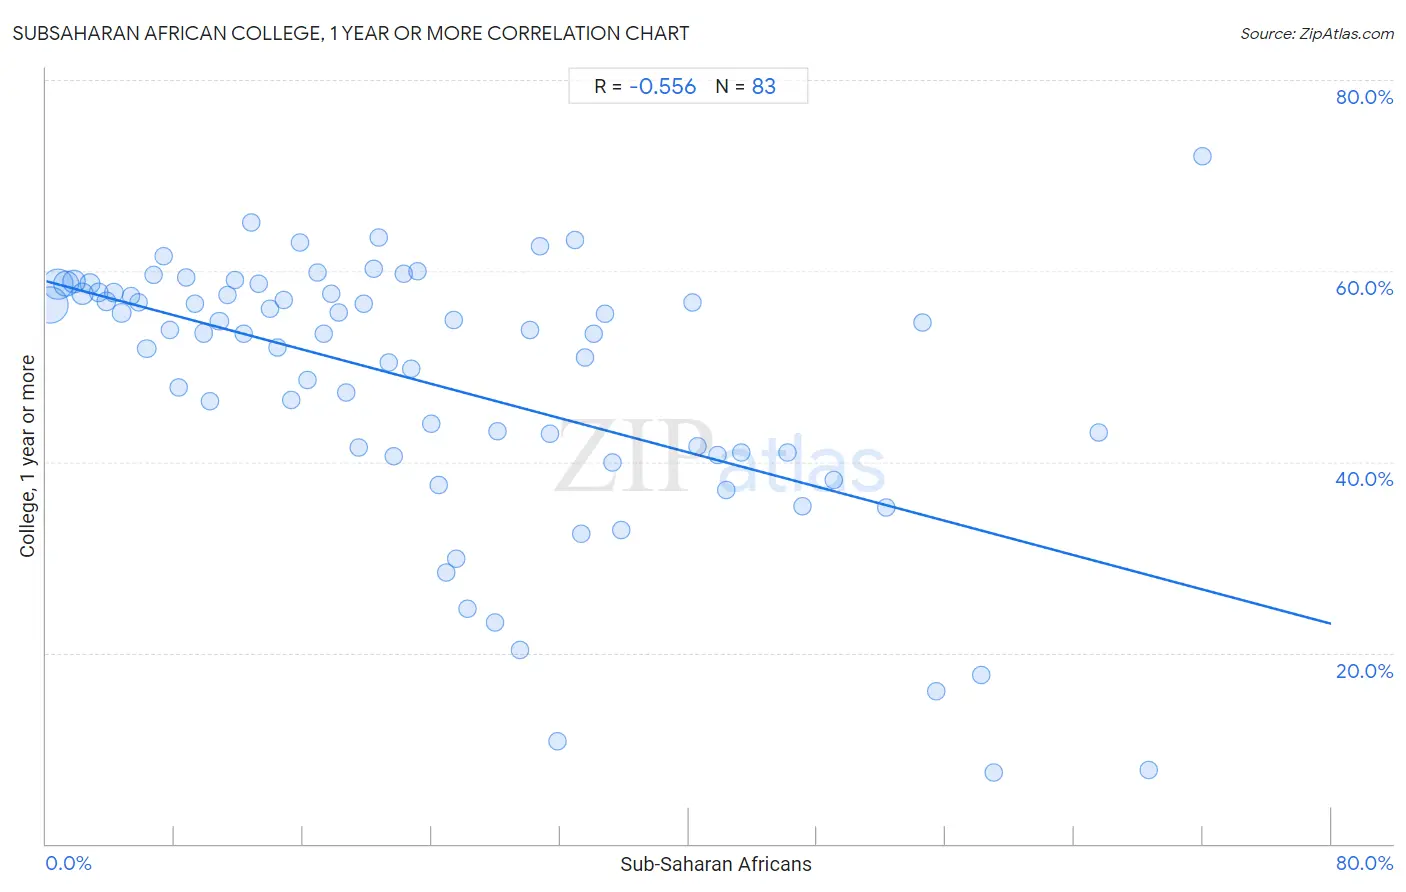
Subsaharan African College, 1 year or more Correlation Chart
The statistical analysis conducted on geographies consisting of 508,212,148 people shows a substantial negative correlation between the proportion of Sub-Saharan Africans and percentage of population with at least college, 1 year or more education in the United States with a correlation coefficient (R) of -0.556 and weighted average of 57.3%. On average, for every 1% (one percent) increase in Sub-Saharan Africans within a typical geography, there is a decrease of 0.45% in percentage of population with at least college, 1 year or more education.
It is essential to understand that the correlation between the percentage of Sub-Saharan Africans and percentage of population with at least college, 1 year or more education does not imply a direct cause-and-effect relationship. It remains uncertain whether the presence of Sub-Saharan Africans influences an upward or downward trend in the level of percentage of population with at least college, 1 year or more education within an area, or if Sub-Saharan Africans simply ended up residing in those areas with higher or lower levels of percentage of population with at least college, 1 year or more education due to other factors.
Demographics Similar to Sub-Saharan Africans by College, 1 year or more
In terms of college, 1 year or more, the demographic groups most similar to Sub-Saharan Africans are Portuguese (57.2%, a difference of 0.17%), Hmong (57.2%, a difference of 0.17%), Immigrants from Ghana (57.4%, a difference of 0.34%), Vietnamese (57.0%, a difference of 0.38%), and Immigrants from Western Africa (57.0%, a difference of 0.40%).
| Demographics | Rating | Rank | College, 1 year or more |
| Tongans | 11.6 /100 | #215 | Poor 57.8% |
| Immigrants from Peru | 10.6 /100 | #216 | Poor 57.7% |
| Immigrants from Panama | 9.1 /100 | #217 | Tragic 57.6% |
| Native Hawaiians | 9.0 /100 | #218 | Tragic 57.6% |
| Whites/Caucasians | 8.7 /100 | #219 | Tragic 57.6% |
| Immigrants from Costa Rica | 8.0 /100 | #220 | Tragic 57.5% |
| Immigrants from Ghana | 7.7 /100 | #221 | Tragic 57.4% |
| Sub-Saharan Africans | 6.1 /100 | #222 | Tragic 57.3% |
| Portuguese | 5.4 /100 | #223 | Tragic 57.2% |
| Hmong | 5.4 /100 | #224 | Tragic 57.2% |
| Vietnamese | 4.7 /100 | #225 | Tragic 57.0% |
| Immigrants from Western Africa | 4.6 /100 | #226 | Tragic 57.0% |
| Immigrants | 4.4 /100 | #227 | Tragic 57.0% |
| Immigrants from Fiji | 4.0 /100 | #228 | Tragic 56.9% |
| Cree | 3.6 /100 | #229 | Tragic 56.8% |
Subsaharan African College, 1 year or more Correlation Summary
| Measurement | Subsaharan African Data | College, 1 year or more Data |
| Minimum | 0.24% | 7.4% |
| Maximum | 72.0% | 72.0% |
| Range | 71.8% | 64.6% |
| Mean | 24.0% | 48.2% |
| Median | 20.7% | 53.5% |
| Interquartile 25% (IQ1) | 10.2% | 40.9% |
| Interquartile 75% (IQ3) | 33.5% | 57.8% |
| Interquartile Range (IQR) | 23.3% | 16.8% |
| Standard Deviation (Sample) | 17.3% | 14.0% |
| Standard Deviation (Population) | 17.2% | 13.9% |
Correlation Details
| Subsaharan African Percentile | Sample Size | College, 1 year or more |
[ 0.0% - 0.5% ] 0.24% | 172,485,741 | 56.4% |
[ 0.5% - 1.0% ] 0.72% | 107,001,285 | 58.6% |
[ 1.0% - 1.5% ] 1.24% | 70,728,281 | 58.7% |
[ 1.5% - 2.0% ] 1.73% | 41,296,680 | 58.9% |
[ 2.0% - 2.5% ] 2.25% | 34,309,487 | 57.7% |
[ 2.5% - 3.0% ] 2.73% | 23,424,739 | 58.7% |
[ 3.0% - 3.5% ] 3.23% | 13,257,378 | 57.8% |
[ 3.5% - 4.0% ] 3.75% | 9,307,532 | 56.8% |
[ 4.0% - 4.5% ] 4.22% | 8,866,712 | 57.8% |
[ 4.5% - 5.0% ] 4.71% | 4,074,514 | 55.6% |
[ 5.0% - 5.5% ] 5.29% | 3,789,296 | 57.4% |
[ 5.5% - 6.0% ] 5.77% | 3,297,562 | 56.7% |
[ 6.0% - 6.5% ] 6.26% | 2,200,977 | 51.9% |
[ 6.5% - 7.0% ] 6.66% | 2,520,084 | 59.6% |
[ 7.0% - 7.5% ] 7.34% | 1,491,776 | 61.5% |
[ 7.5% - 8.0% ] 7.73% | 1,554,431 | 53.9% |
[ 8.0% - 8.5% ] 8.23% | 994,167 | 47.8% |
[ 8.5% - 9.0% ] 8.72% | 992,684 | 59.3% |
[ 9.0% - 9.5% ] 9.27% | 873,302 | 56.5% |
[ 9.5% - 10.0% ] 9.78% | 413,340 | 53.5% |
[ 10.0% - 10.5% ] 10.22% | 754,338 | 46.4% |
[ 10.5% - 11.0% ] 10.78% | 531,110 | 54.8% |
[ 11.0% - 11.5% ] 11.27% | 653,154 | 57.5% |
[ 11.5% - 12.0% ] 11.75% | 279,446 | 59.0% |
[ 12.0% - 12.5% ] 12.27% | 101,415 | 53.5% |
[ 12.5% - 13.0% ] 12.77% | 185,624 | 65.0% |
[ 13.0% - 13.5% ] 13.23% | 438,997 | 58.6% |
[ 13.5% - 14.0% ] 13.91% | 351,800 | 56.0% |
[ 14.0% - 14.5% ] 14.38% | 83,868 | 52.0% |
[ 14.5% - 15.0% ] 14.81% | 134,736 | 56.9% |
[ 15.0% - 15.5% ] 15.22% | 236,677 | 46.5% |
[ 15.5% - 16.0% ] 15.83% | 220,043 | 63.0% |
[ 16.0% - 16.5% ] 16.25% | 194,496 | 48.6% |
[ 16.5% - 17.0% ] 16.91% | 30,595 | 59.8% |
[ 17.0% - 17.5% ] 17.26% | 146,130 | 53.4% |
[ 17.5% - 18.0% ] 17.73% | 65,973 | 57.7% |
[ 18.0% - 18.5% ] 18.20% | 221,484 | 55.6% |
[ 18.5% - 19.0% ] 18.66% | 97,301 | 47.3% |
[ 19.0% - 19.5% ] 19.43% | 243,526 | 41.5% |
[ 19.5% - 20.0% ] 19.74% | 20,175 | 56.6% |
[ 20.0% - 20.5% ] 20.40% | 38,846 | 60.2% |
[ 20.5% - 21.0% ] 20.73% | 34,831 | 63.5% |
[ 21.0% - 21.5% ] 21.30% | 28,219 | 50.4% |
[ 21.5% - 22.0% ] 21.65% | 54,524 | 40.6% |
[ 22.0% - 22.5% ] 22.26% | 283 | 59.7% |
[ 22.5% - 23.0% ] 22.71% | 52,239 | 49.7% |
[ 23.0% - 23.5% ] 23.08% | 208 | 60.0% |
[ 23.5% - 24.0% ] 23.99% | 14,696 | 44.1% |
[ 24.0% - 24.5% ] 24.43% | 25,424 | 37.6% |
[ 24.5% - 25.0% ] 24.86% | 370 | 28.5% |
[ 25.0% - 25.5% ] 25.38% | 658 | 54.9% |
[ 25.5% - 26.0% ] 25.54% | 881 | 29.8% |
[ 26.0% - 26.5% ] 26.24% | 2,138 | 24.6% |
[ 27.5% - 28.0% ] 27.93% | 512 | 23.2% |
[ 28.0% - 28.5% ] 28.06% | 29,898 | 43.3% |
[ 29.5% - 30.0% ] 29.53% | 2,313 | 20.3% |
[ 30.0% - 30.5% ] 30.14% | 2,037 | 53.8% |
[ 30.5% - 31.0% ] 30.74% | 15,489 | 62.6% |
[ 31.0% - 31.5% ] 31.35% | 2,485 | 43.0% |
[ 31.5% - 32.0% ] 31.81% | 1,311 | 10.8% |
[ 32.5% - 33.0% ] 32.93% | 334 | 63.2% |
[ 33.0% - 33.5% ] 33.33% | 54 | 32.4% |
[ 33.5% - 34.0% ] 33.53% | 173 | 51.0% |
[ 34.0% - 34.5% ] 34.07% | 3,824 | 53.4% |
[ 34.5% - 35.0% ] 34.78% | 46 | 55.6% |
[ 35.0% - 35.5% ] 35.23% | 1,286 | 39.9% |
[ 35.5% - 36.0% ] 35.82% | 67 | 32.8% |
[ 40.0% - 40.5% ] 40.22% | 4,572 | 56.7% |
[ 40.5% - 41.0% ] 40.56% | 9,613 | 41.6% |
[ 41.5% - 42.0% ] 41.76% | 613 | 40.7% |
[ 42.0% - 42.5% ] 42.31% | 338 | 37.1% |
[ 43.0% - 43.5% ] 43.29% | 633 | 40.9% |
[ 46.0% - 46.5% ] 46.15% | 78 | 41.0% |
[ 47.0% - 47.5% ] 47.10% | 1,157 | 35.4% |
[ 49.0% - 49.5% ] 49.02% | 9,074 | 38.1% |
[ 52.0% - 52.5% ] 52.27% | 88 | 35.2% |
[ 54.5% - 55.0% ] 54.55% | 11 | 54.5% |
[ 55.0% - 55.5% ] 55.41% | 231 | 16.0% |
[ 58.0% - 58.5% ] 58.19% | 574 | 17.6% |
[ 59.0% - 59.5% ] 59.02% | 549 | 7.4% |
[ 65.5% - 66.0% ] 65.55% | 479 | 43.0% |
[ 68.5% - 69.0% ] 68.60% | 86 | 7.7% |
[ 72.0% - 72.5% ] 72.00% | 50 | 72.0% |