Subsaharan African Family Poverty
COMPARE
Subsaharan African
Select to Compare
Family Poverty
Subsaharan African Family Poverty
10.9%
POVERTY | FAMILIES
0.2/ 100
METRIC RATING
258th/ 347
METRIC RANK
Subsaharan African Family Poverty Correlation Chart
The statistical analysis conducted on geographies consisting of 506,098,570 people shows a substantial positive correlation between the proportion of Sub-Saharan Africans and poverty level among families in the United States with a correlation coefficient (R) of 0.508 and weighted average of 10.9%. On average, for every 1% (one percent) increase in Sub-Saharan Africans within a typical geography, there is an increase of 0.34% in poverty level among families.
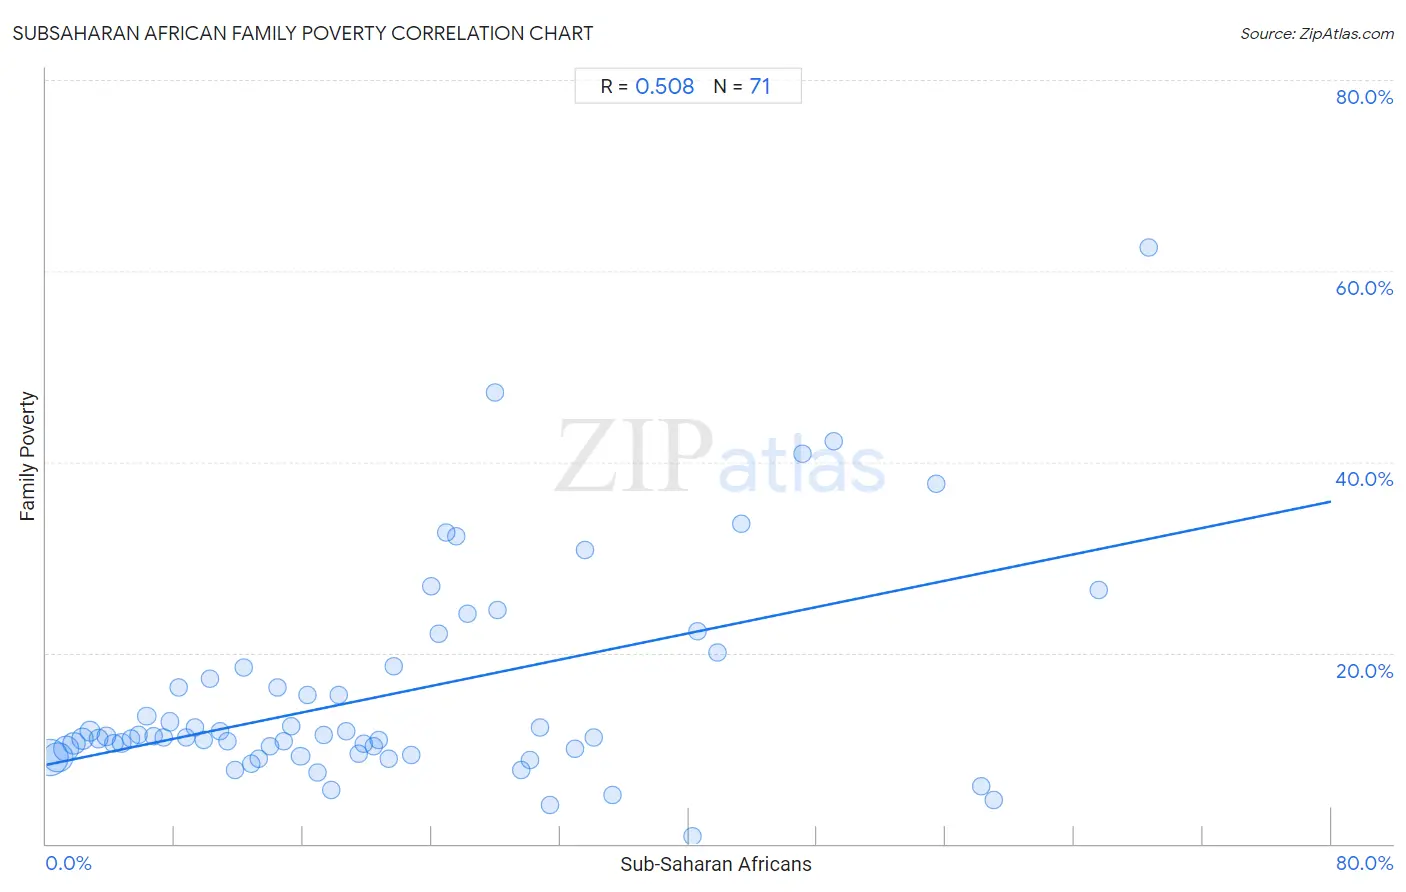
It is essential to understand that the correlation between the percentage of Sub-Saharan Africans and poverty level among families does not imply a direct cause-and-effect relationship. It remains uncertain whether the presence of Sub-Saharan Africans influences an upward or downward trend in the level of poverty level among families within an area, or if Sub-Saharan Africans simply ended up residing in those areas with higher or lower levels of poverty level among families due to other factors.
Demographics Similar to Sub-Saharan Africans by Family Poverty
In terms of family poverty, the demographic groups most similar to Sub-Saharan Africans are Immigrants from Ghana (10.8%, a difference of 0.030%), Mexican American Indian (10.9%, a difference of 0.040%), Chickasaw (10.8%, a difference of 0.070%), Immigrants from Liberia (10.8%, a difference of 0.34%), and Bangladeshi (10.9%, a difference of 0.39%).
| Demographics | Rating | Rank | Family Poverty |
| Iroquois | 0.3 /100 | #251 | Tragic 10.7% |
| Immigrants from Zaire | 0.3 /100 | #252 | Tragic 10.7% |
| Immigrants from Western Africa | 0.3 /100 | #253 | Tragic 10.7% |
| Ecuadorians | 0.2 /100 | #254 | Tragic 10.8% |
| Immigrants from Liberia | 0.2 /100 | #255 | Tragic 10.8% |
| Chickasaw | 0.2 /100 | #256 | Tragic 10.8% |
| Immigrants from Ghana | 0.2 /100 | #257 | Tragic 10.8% |
| Sub-Saharan Africans | 0.2 /100 | #258 | Tragic 10.9% |
| Mexican American Indians | 0.2 /100 | #259 | Tragic 10.9% |
| Bangladeshis | 0.2 /100 | #260 | Tragic 10.9% |
| Shoshone | 0.2 /100 | #261 | Tragic 10.9% |
| Spanish American Indians | 0.2 /100 | #262 | Tragic 10.9% |
| Cape Verdeans | 0.1 /100 | #263 | Tragic 10.9% |
| Trinidadians and Tobagonians | 0.1 /100 | #264 | Tragic 10.9% |
| Immigrants from Trinidad and Tobago | 0.1 /100 | #265 | Tragic 10.9% |
Subsaharan African Family Poverty Correlation Summary
| Measurement | Subsaharan African Data | Family Poverty Data |
| Minimum | 0.24% | 0.78% |
| Maximum | 68.6% | 62.5% |
| Range | 68.4% | 61.7% |
| Mean | 21.3% | 15.6% |
| Median | 17.7% | 11.1% |
| Interquartile 25% (IQ1) | 8.7% | 9.4% |
| Interquartile 75% (IQ3) | 30.1% | 18.4% |
| Interquartile Range (IQR) | 21.4% | 9.0% |
| Standard Deviation (Sample) | 16.4% | 11.1% |
| Standard Deviation (Population) | 16.3% | 11.0% |
Correlation Details
| Subsaharan African Percentile | Sample Size | Family Poverty |
[ 0.0% - 0.5% ] 0.24% | 171,776,448 | 9.0% |
[ 0.5% - 1.0% ] 0.72% | 106,647,790 | 9.0% |
[ 1.0% - 1.5% ] 1.24% | 70,480,759 | 9.9% |
[ 1.5% - 2.0% ] 1.73% | 41,114,918 | 10.5% |
[ 2.0% - 2.5% ] 2.25% | 34,174,613 | 11.0% |
[ 2.5% - 3.0% ] 2.73% | 23,339,488 | 11.7% |
[ 3.0% - 3.5% ] 3.23% | 13,172,882 | 11.1% |
[ 3.5% - 4.0% ] 3.75% | 9,257,121 | 11.2% |
[ 4.0% - 4.5% ] 4.22% | 8,840,412 | 10.5% |
[ 4.5% - 5.0% ] 4.71% | 4,043,138 | 10.6% |
[ 5.0% - 5.5% ] 5.29% | 3,756,377 | 11.1% |
[ 5.5% - 6.0% ] 5.77% | 3,263,350 | 11.4% |
[ 6.0% - 6.5% ] 6.26% | 2,199,972 | 13.4% |
[ 6.5% - 7.0% ] 6.66% | 2,504,750 | 11.3% |
[ 7.0% - 7.5% ] 7.34% | 1,482,286 | 11.1% |
[ 7.5% - 8.0% ] 7.73% | 1,530,634 | 12.8% |
[ 8.0% - 8.5% ] 8.23% | 984,135 | 16.4% |
[ 8.5% - 9.0% ] 8.72% | 991,936 | 11.1% |
[ 9.0% - 9.5% ] 9.27% | 860,702 | 12.2% |
[ 9.5% - 10.0% ] 9.78% | 404,681 | 10.8% |
[ 10.0% - 10.5% ] 10.22% | 743,514 | 17.3% |
[ 10.5% - 11.0% ] 10.78% | 526,310 | 11.7% |
[ 11.0% - 11.5% ] 11.27% | 647,876 | 10.8% |
[ 11.5% - 12.0% ] 11.75% | 279,205 | 7.7% |
[ 12.0% - 12.5% ] 12.27% | 98,987 | 18.4% |
[ 12.5% - 13.0% ] 12.77% | 180,041 | 8.4% |
[ 13.0% - 13.5% ] 13.23% | 438,825 | 8.9% |
[ 13.5% - 14.0% ] 13.92% | 339,333 | 10.2% |
[ 14.0% - 14.5% ] 14.38% | 83,868 | 16.4% |
[ 14.5% - 15.0% ] 14.81% | 134,284 | 10.7% |
[ 15.0% - 15.5% ] 15.22% | 231,880 | 12.2% |
[ 15.5% - 16.0% ] 15.84% | 217,851 | 9.2% |
[ 16.0% - 16.5% ] 16.25% | 194,091 | 15.5% |
[ 16.5% - 17.0% ] 16.91% | 29,350 | 7.4% |
[ 17.0% - 17.5% ] 17.26% | 145,945 | 11.4% |
[ 17.5% - 18.0% ] 17.73% | 65,973 | 5.6% |
[ 18.0% - 18.5% ] 18.20% | 220,571 | 15.6% |
[ 18.5% - 19.0% ] 18.66% | 97,301 | 11.7% |
[ 19.0% - 19.5% ] 19.43% | 243,201 | 9.4% |
[ 19.5% - 20.0% ] 19.74% | 19,112 | 10.5% |
[ 20.0% - 20.5% ] 20.40% | 38,685 | 10.2% |
[ 20.5% - 21.0% ] 20.73% | 34,807 | 10.8% |
[ 21.0% - 21.5% ] 21.30% | 28,219 | 8.9% |
[ 21.5% - 22.0% ] 21.65% | 54,524 | 18.6% |
[ 22.5% - 23.0% ] 22.71% | 51,871 | 9.2% |
[ 23.5% - 24.0% ] 23.99% | 14,553 | 27.0% |
[ 24.0% - 24.5% ] 24.43% | 25,333 | 21.9% |
[ 24.5% - 25.0% ] 24.91% | 273 | 32.6% |
[ 25.5% - 26.0% ] 25.54% | 881 | 32.2% |
[ 26.0% - 26.5% ] 26.24% | 2,138 | 24.2% |
[ 27.5% - 28.0% ] 27.93% | 512 | 47.3% |
[ 28.0% - 28.5% ] 28.06% | 29,898 | 24.5% |
[ 29.5% - 30.0% ] 29.55% | 44 | 7.7% |
[ 30.0% - 30.5% ] 30.12% | 1,932 | 8.8% |
[ 30.5% - 31.0% ] 30.74% | 15,489 | 12.1% |
[ 31.0% - 31.5% ] 31.35% | 2,485 | 4.1% |
[ 32.5% - 33.0% ] 32.93% | 334 | 9.9% |
[ 33.5% - 34.0% ] 33.53% | 173 | 30.8% |
[ 34.0% - 34.5% ] 34.07% | 3,824 | 11.1% |
[ 35.0% - 35.5% ] 35.23% | 1,286 | 5.1% |
[ 40.0% - 40.5% ] 40.22% | 4,572 | 0.78% |
[ 40.5% - 41.0% ] 40.56% | 9,613 | 22.2% |
[ 41.5% - 42.0% ] 41.76% | 613 | 20.0% |
[ 43.0% - 43.5% ] 43.29% | 633 | 33.5% |
[ 47.0% - 47.5% ] 47.10% | 1,157 | 40.8% |
[ 49.0% - 49.5% ] 49.01% | 8,892 | 42.2% |
[ 55.0% - 55.5% ] 55.41% | 231 | 37.7% |
[ 58.0% - 58.5% ] 58.19% | 574 | 6.1% |
[ 59.0% - 59.5% ] 59.02% | 549 | 4.6% |
[ 65.5% - 66.0% ] 65.55% | 479 | 26.6% |
[ 68.5% - 69.0% ] 68.60% | 86 | 62.5% |