Polish 1 or more Vehicles in Household
COMPARE
Polish
Select to Compare
1 or more Vehicles in Household
Polish 1 or more Vehicles in Household
91.7%
1+ VEHICLES AVAILABLE
99.7/ 100
METRIC RATING
71st/ 347
METRIC RANK
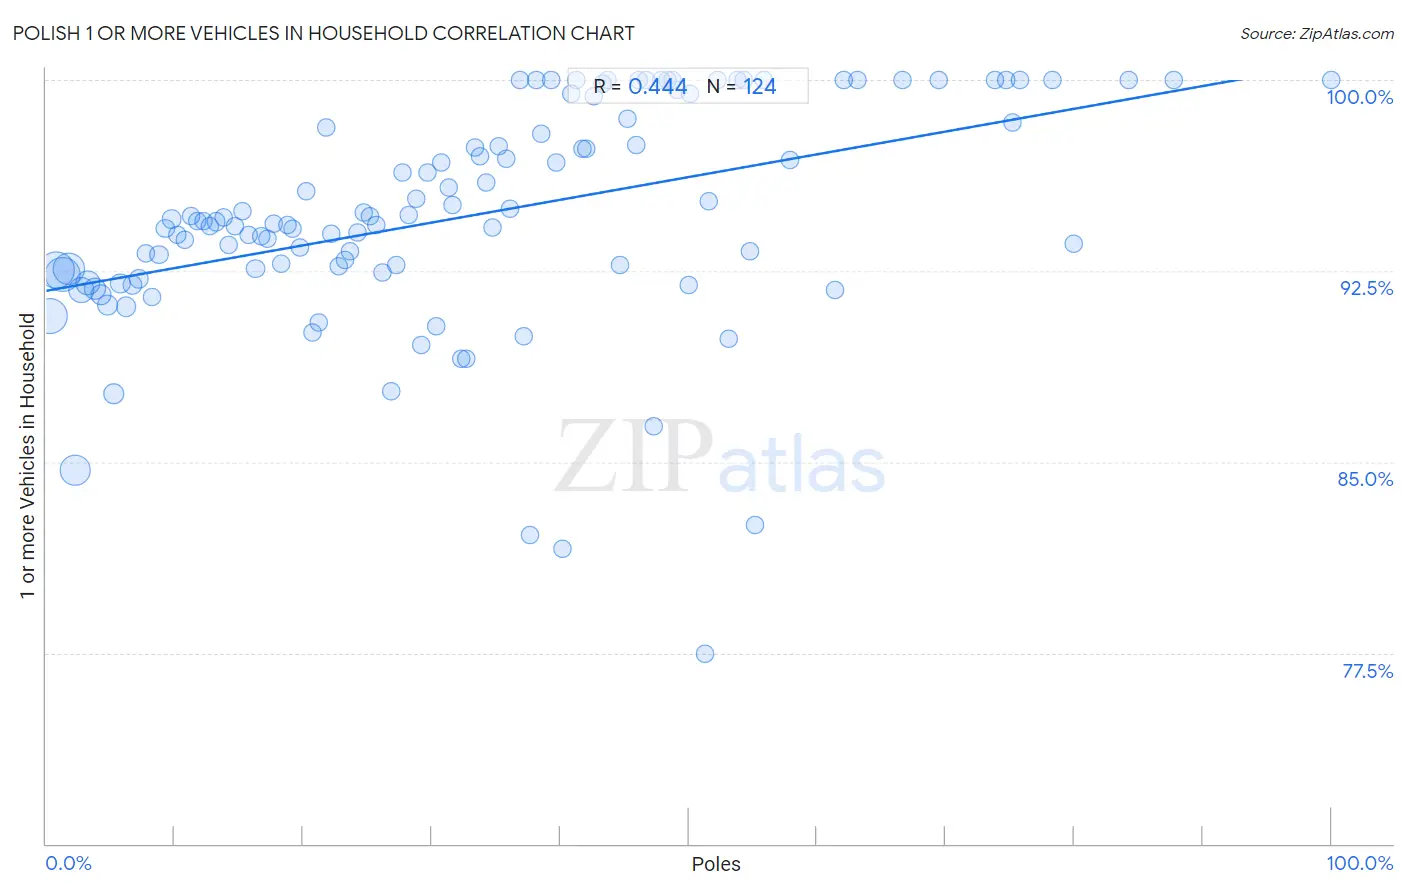
Polish 1 or more Vehicles in Household Correlation Chart
The statistical analysis conducted on geographies consisting of 560,073,045 people shows a moderate positive correlation between the proportion of Poles and percentage of households with 1 or more vehicles available in the United States with a correlation coefficient (R) of 0.444 and weighted average of 91.7%. On average, for every 1% (one percent) increase in Poles within a typical geography, there is an increase of 0.089% in percentage of households with 1 or more vehicles available.
It is essential to understand that the correlation between the percentage of Poles and percentage of households with 1 or more vehicles available does not imply a direct cause-and-effect relationship. It remains uncertain whether the presence of Poles influences an upward or downward trend in the level of percentage of households with 1 or more vehicles available within an area, or if Poles simply ended up residing in those areas with higher or lower levels of percentage of households with 1 or more vehicles available due to other factors.
Demographics Similar to Poles by 1 or more Vehicles in Household
In terms of 1 or more vehicles in household, the demographic groups most similar to Poles are Cajun (91.7%, a difference of 0.0%), Immigrants from Iran (91.7%, a difference of 0.010%), Lithuanian (91.7%, a difference of 0.020%), Palestinian (91.7%, a difference of 0.040%), and Immigrants from Lebanon (91.6%, a difference of 0.050%).
| Demographics | Rating | Rank | 1 or more Vehicles in Household |
| Croatians | 99.8 /100 | #64 | Exceptional 91.9% |
| Immigrants from Laos | 99.8 /100 | #65 | Exceptional 91.8% |
| Canadians | 99.8 /100 | #66 | Exceptional 91.8% |
| Spaniards | 99.8 /100 | #67 | Exceptional 91.8% |
| Immigrants from Scotland | 99.7 /100 | #68 | Exceptional 91.8% |
| Palestinians | 99.7 /100 | #69 | Exceptional 91.7% |
| Lithuanians | 99.7 /100 | #70 | Exceptional 91.7% |
| Poles | 99.7 /100 | #71 | Exceptional 91.7% |
| Cajuns | 99.7 /100 | #72 | Exceptional 91.7% |
| Immigrants from Iran | 99.7 /100 | #73 | Exceptional 91.7% |
| Immigrants from Lebanon | 99.6 /100 | #74 | Exceptional 91.6% |
| Portuguese | 99.5 /100 | #75 | Exceptional 91.6% |
| Cubans | 99.5 /100 | #76 | Exceptional 91.5% |
| Immigrants from Philippines | 99.4 /100 | #77 | Exceptional 91.5% |
| Iranians | 99.4 /100 | #78 | Exceptional 91.5% |
Polish 1 or more Vehicles in Household Correlation Summary
| Measurement | Polish Data | 1 or more Vehicles in Household Data |
| Minimum | 0.26% | 77.5% |
| Maximum | 100.0% | 100.0% |
| Range | 99.7% | 22.5% |
| Mean | 33.0% | 94.7% |
| Median | 31.0% | 94.4% |
| Interquartile 25% (IQ1) | 15.5% | 92.5% |
| Interquartile 75% (IQ3) | 47.0% | 98.4% |
| Interquartile Range (IQR) | 31.5% | 5.9% |
| Standard Deviation (Sample) | 21.8% | 4.4% |
| Standard Deviation (Population) | 21.7% | 4.4% |
Correlation Details
| Polish Percentile | Sample Size | 1 or more Vehicles in Household |
[ 0.0% - 0.5% ] 0.26% | 84,722,619 | 90.7% |
[ 0.5% - 1.0% ] 0.76% | 88,906,312 | 92.5% |
[ 1.0% - 1.5% ] 1.26% | 82,129,205 | 92.4% |
[ 1.5% - 2.0% ] 1.74% | 64,519,474 | 92.6% |
[ 2.0% - 2.5% ] 2.23% | 57,208,253 | 84.7% |
[ 2.5% - 3.0% ] 2.75% | 34,976,457 | 91.8% |
[ 3.0% - 3.5% ] 3.24% | 26,613,221 | 92.0% |
[ 3.5% - 4.0% ] 3.76% | 18,268,447 | 91.8% |
[ 4.0% - 4.5% ] 4.24% | 14,248,658 | 91.6% |
[ 4.5% - 5.0% ] 4.74% | 11,047,333 | 91.2% |
[ 5.0% - 5.5% ] 5.21% | 11,852,612 | 87.7% |
[ 5.5% - 6.0% ] 5.75% | 9,056,981 | 92.0% |
[ 6.0% - 6.5% ] 6.23% | 6,976,050 | 91.1% |
[ 6.5% - 7.0% ] 6.74% | 6,390,246 | 92.0% |
[ 7.0% - 7.5% ] 7.21% | 5,119,203 | 92.2% |
[ 7.5% - 8.0% ] 7.74% | 3,766,940 | 93.2% |
[ 8.0% - 8.5% ] 8.23% | 4,671,296 | 91.5% |
[ 8.5% - 9.0% ] 8.75% | 3,700,240 | 93.1% |
[ 9.0% - 9.5% ] 9.24% | 3,045,104 | 94.2% |
[ 9.5% - 10.0% ] 9.75% | 2,487,303 | 94.5% |
[ 10.0% - 10.5% ] 10.22% | 1,921,862 | 93.9% |
[ 10.5% - 11.0% ] 10.76% | 2,037,417 | 93.7% |
[ 11.0% - 11.5% ] 11.25% | 1,907,513 | 94.6% |
[ 11.5% - 12.0% ] 11.72% | 1,646,668 | 94.5% |
[ 12.0% - 12.5% ] 12.21% | 1,485,321 | 94.5% |
[ 12.5% - 13.0% ] 12.77% | 1,294,161 | 94.3% |
[ 13.0% - 13.5% ] 13.23% | 1,280,268 | 94.4% |
[ 13.5% - 14.0% ] 13.77% | 758,336 | 94.6% |
[ 14.0% - 14.5% ] 14.23% | 1,042,778 | 93.5% |
[ 14.5% - 15.0% ] 14.72% | 646,306 | 94.3% |
[ 15.0% - 15.5% ] 15.27% | 740,308 | 94.9% |
[ 15.5% - 16.0% ] 15.73% | 748,283 | 93.9% |
[ 16.0% - 16.5% ] 16.29% | 834,790 | 92.6% |
[ 16.5% - 17.0% ] 16.74% | 357,360 | 93.9% |
[ 17.0% - 17.5% ] 17.22% | 363,511 | 93.8% |
[ 17.5% - 18.0% ] 17.72% | 399,896 | 94.3% |
[ 18.0% - 18.5% ] 18.25% | 354,965 | 92.8% |
[ 18.5% - 19.0% ] 18.78% | 356,975 | 94.3% |
[ 19.0% - 19.5% ] 19.19% | 174,156 | 94.2% |
[ 19.5% - 20.0% ] 19.77% | 177,145 | 93.4% |
[ 20.0% - 20.5% ] 20.26% | 207,786 | 95.6% |
[ 20.5% - 21.0% ] 20.69% | 55,700 | 90.1% |
[ 21.0% - 21.5% ] 21.24% | 83,672 | 90.5% |
[ 21.5% - 22.0% ] 21.79% | 64,400 | 98.1% |
[ 22.0% - 22.5% ] 22.15% | 145,427 | 94.0% |
[ 22.5% - 23.0% ] 22.72% | 166,088 | 92.7% |
[ 23.0% - 23.5% ] 23.26% | 105,296 | 92.9% |
[ 23.5% - 24.0% ] 23.67% | 40,369 | 93.3% |
[ 24.0% - 24.5% ] 24.22% | 136,179 | 94.0% |
[ 24.5% - 25.0% ] 24.76% | 72,134 | 94.8% |
[ 25.0% - 25.5% ] 25.23% | 118,891 | 94.6% |
[ 25.5% - 26.0% ] 25.68% | 19,673 | 94.3% |
[ 26.0% - 26.5% ] 26.16% | 117,161 | 92.4% |
[ 26.5% - 27.0% ] 26.88% | 39,861 | 87.8% |
[ 27.0% - 27.5% ] 27.20% | 17,012 | 92.7% |
[ 27.5% - 28.0% ] 27.70% | 40,891 | 96.3% |
[ 28.0% - 28.5% ] 28.19% | 12,725 | 94.7% |
[ 28.5% - 29.0% ] 28.76% | 73,969 | 95.3% |
[ 29.0% - 29.5% ] 29.20% | 10,643 | 89.6% |
[ 29.5% - 30.0% ] 29.64% | 9,498 | 96.3% |
[ 30.0% - 30.5% ] 30.32% | 31,030 | 90.3% |
[ 30.5% - 31.0% ] 30.73% | 15,000 | 96.8% |
[ 31.0% - 31.5% ] 31.28% | 84,108 | 95.8% |
[ 31.5% - 32.0% ] 31.58% | 36,002 | 95.1% |
[ 32.0% - 32.5% ] 32.28% | 31,457 | 89.0% |
[ 32.5% - 33.0% ] 32.65% | 23,370 | 89.1% |
[ 33.0% - 33.5% ] 33.35% | 4,183 | 97.3% |
[ 33.5% - 34.0% ] 33.80% | 2,139 | 97.0% |
[ 34.0% - 34.5% ] 34.22% | 9,931 | 96.0% |
[ 34.5% - 35.0% ] 34.77% | 604 | 94.2% |
[ 35.0% - 35.5% ] 35.17% | 1,396 | 97.4% |
[ 35.5% - 36.0% ] 35.75% | 1,102 | 96.9% |
[ 36.0% - 36.5% ] 36.08% | 2,098 | 94.9% |
[ 36.5% - 37.0% ] 36.84% | 608 | 100.0% |
[ 37.0% - 37.5% ] 37.12% | 23,964 | 90.0% |
[ 37.5% - 38.0% ] 37.62% | 2,294 | 82.1% |
[ 38.0% - 38.5% ] 38.10% | 63 | 100.0% |
[ 38.5% - 39.0% ] 38.55% | 1,603 | 97.9% |
[ 39.0% - 39.5% ] 39.34% | 943 | 100.0% |
[ 39.5% - 40.0% ] 39.65% | 2,507 | 96.8% |
[ 40.0% - 40.5% ] 40.16% | 1,016 | 81.6% |
[ 40.5% - 41.0% ] 40.86% | 1,263 | 99.5% |
[ 41.0% - 41.5% ] 41.21% | 182 | 100.0% |
[ 41.5% - 42.0% ] 41.78% | 529 | 97.3% |
[ 42.0% - 42.5% ] 42.07% | 3,076 | 97.3% |
[ 42.5% - 43.0% ] 42.58% | 310 | 99.4% |
[ 43.0% - 43.5% ] 43.31% | 1,494 | 99.9% |
[ 43.5% - 44.0% ] 43.67% | 245 | 100.0% |
[ 44.5% - 45.0% ] 44.62% | 1,739 | 92.7% |
[ 45.0% - 45.5% ] 45.24% | 336 | 98.5% |
[ 45.5% - 46.0% ] 45.90% | 2,549 | 97.4% |
[ 46.0% - 46.5% ] 46.15% | 91 | 100.0% |
[ 46.5% - 47.0% ] 46.74% | 460 | 100.0% |
[ 47.0% - 47.5% ] 47.24% | 3,497 | 86.4% |
[ 47.5% - 48.0% ] 47.83% | 23 | 100.0% |
[ 48.0% - 48.5% ] 48.39% | 31 | 100.0% |
[ 48.5% - 49.0% ] 48.78% | 41 | 100.0% |
[ 49.0% - 49.5% ] 49.10% | 2,067 | 99.6% |
[ 50.0% - 50.5% ] 50.00% | 368 | 91.9% |
[ 50.0% - 50.5% ] 50.14% | 2,140 | 99.5% |
[ 51.0% - 51.5% ] 51.31% | 1,183 | 77.5% |
[ 51.5% - 52.0% ] 51.59% | 283 | 95.2% |
[ 52.0% - 52.5% ] 52.27% | 44 | 100.0% |
[ 53.0% - 53.5% ] 53.08% | 130 | 89.9% |
[ 53.5% - 54.0% ] 53.81% | 433 | 100.0% |
[ 54.0% - 54.5% ] 54.29% | 35 | 100.0% |
[ 54.5% - 55.0% ] 54.74% | 190 | 93.3% |
[ 55.0% - 55.5% ] 55.19% | 183 | 82.5% |
[ 55.5% - 56.0% ] 55.81% | 568 | 100.0% |
[ 57.5% - 58.0% ] 57.88% | 387 | 96.9% |
[ 61.0% - 61.5% ] 61.42% | 324 | 91.8% |
[ 62.0% - 62.5% ] 62.07% | 29 | 100.0% |
[ 63.0% - 63.5% ] 63.10% | 84 | 100.0% |
[ 66.5% - 67.0% ] 66.67% | 36 | 100.0% |
[ 69.0% - 69.5% ] 69.48% | 154 | 100.0% |
[ 73.5% - 74.0% ] 73.81% | 84 | 100.0% |
[ 74.5% - 75.0% ] 74.69% | 573 | 100.0% |
[ 75.0% - 75.5% ] 75.22% | 226 | 98.3% |
[ 75.5% - 76.0% ] 75.75% | 268 | 100.0% |
[ 78.0% - 78.5% ] 78.26% | 46 | 100.0% |
[ 80.0% - 80.5% ] 80.00% | 105 | 93.6% |
[ 84.0% - 84.5% ] 84.24% | 184 | 100.0% |
[ 87.5% - 88.0% ] 87.76% | 237 | 100.0% |
[ 99.5% - 100.0% ] 100.00% | 52 | 100.0% |