Immigrants from Ukraine 1 or more Vehicles in Household
COMPARE
Immigrants from Ukraine
Select to Compare
1 or more Vehicles in Household
Immigrants from Ukraine 1 or more Vehicles in Household
85.2%
1+ VEHICLES AVAILABLE
0.0/ 100
METRIC RATING
304th/ 347
METRIC RANK
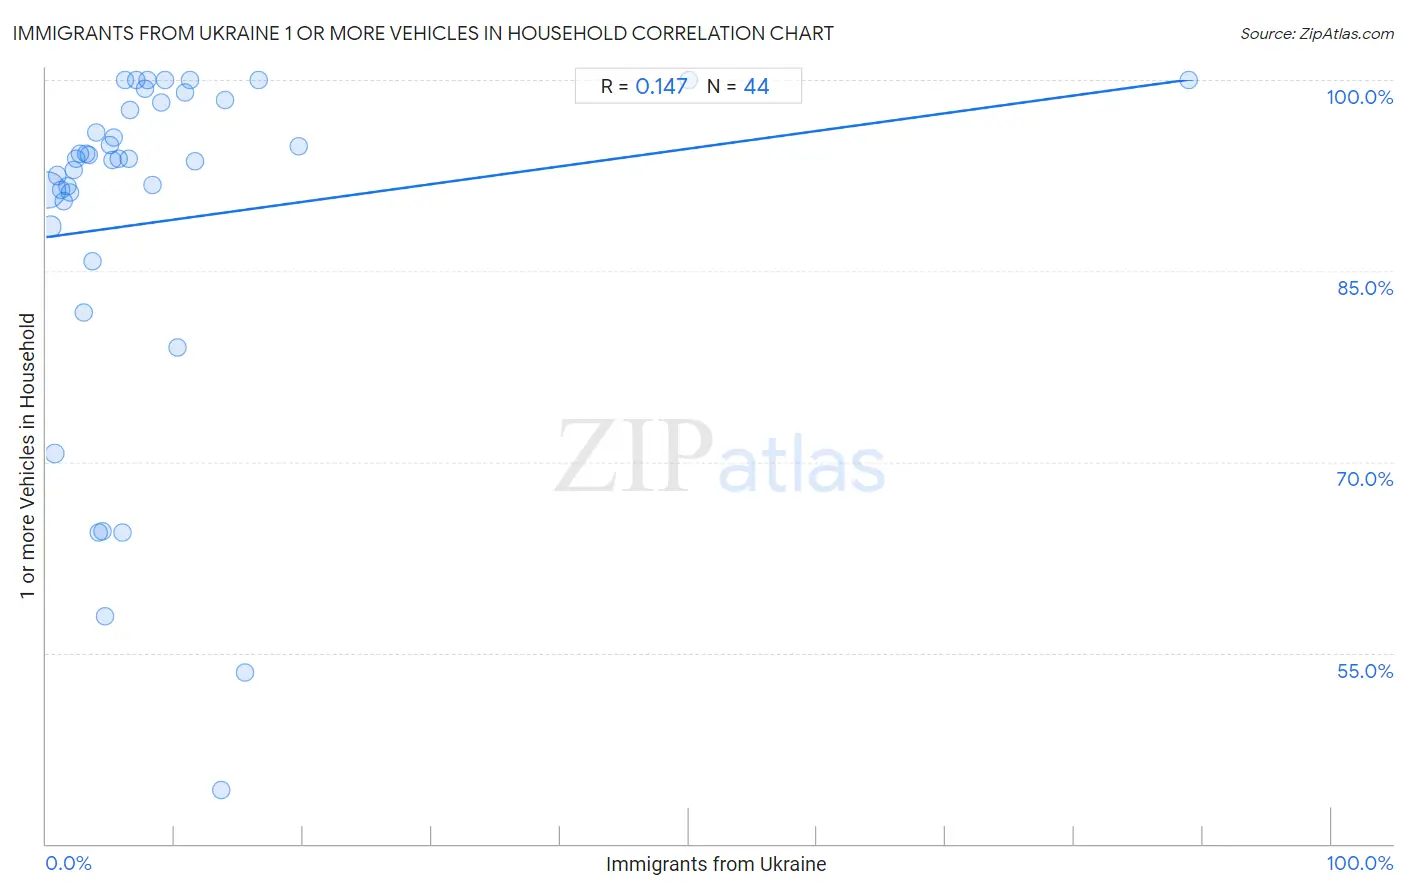
Immigrants from Ukraine 1 or more Vehicles in Household Correlation Chart
The statistical analysis conducted on geographies consisting of 289,657,914 people shows a poor positive correlation between the proportion of Immigrants from Ukraine and percentage of households with 1 or more vehicles available in the United States with a correlation coefficient (R) of 0.147 and weighted average of 85.2%. On average, for every 1% (one percent) increase in Immigrants from Ukraine within a typical geography, there is an increase of 0.14% in percentage of households with 1 or more vehicles available.
It is essential to understand that the correlation between the percentage of Immigrants from Ukraine and percentage of households with 1 or more vehicles available does not imply a direct cause-and-effect relationship. It remains uncertain whether the presence of Immigrants from Ukraine influences an upward or downward trend in the level of percentage of households with 1 or more vehicles available within an area, or if Immigrants from Ukraine simply ended up residing in those areas with higher or lower levels of percentage of households with 1 or more vehicles available due to other factors.
Demographics Similar to Immigrants from Ukraine by 1 or more Vehicles in Household
In terms of 1 or more vehicles in household, the demographic groups most similar to Immigrants from Ukraine are Immigrants from Greece (85.4%, a difference of 0.17%), Moroccan (85.4%, a difference of 0.20%), Immigrants from Panama (85.4%, a difference of 0.22%), Yuman (85.5%, a difference of 0.26%), and Immigrants from Russia (85.4%, a difference of 0.26%).
| Demographics | Rating | Rank | 1 or more Vehicles in Household |
| Paraguayans | 0.0 /100 | #297 | Tragic 85.7% |
| Belizeans | 0.0 /100 | #298 | Tragic 85.7% |
| Yuman | 0.0 /100 | #299 | Tragic 85.5% |
| Immigrants from Russia | 0.0 /100 | #300 | Tragic 85.4% |
| Immigrants from Panama | 0.0 /100 | #301 | Tragic 85.4% |
| Moroccans | 0.0 /100 | #302 | Tragic 85.4% |
| Immigrants from Greece | 0.0 /100 | #303 | Tragic 85.4% |
| Immigrants from Ukraine | 0.0 /100 | #304 | Tragic 85.2% |
| Immigrants from China | 0.0 /100 | #305 | Tragic 84.9% |
| Immigrants from Western Africa | 0.0 /100 | #306 | Tragic 84.9% |
| Tohono O'odham | 0.0 /100 | #307 | Tragic 84.7% |
| Immigrants from Belize | 0.0 /100 | #308 | Tragic 84.7% |
| Immigrants from Haiti | 0.0 /100 | #309 | Tragic 84.7% |
| U.S. Virgin Islanders | 0.0 /100 | #310 | Tragic 84.6% |
| Puerto Ricans | 0.0 /100 | #311 | Tragic 84.6% |
Immigrants from Ukraine 1 or more Vehicles in Household Correlation Summary
| Measurement | Immigrants from Ukraine Data | 1 or more Vehicles in Household Data |
| Minimum | 0.080% | 44.2% |
| Maximum | 88.9% | 100.0% |
| Range | 88.8% | 55.8% |
| Mean | 9.1% | 88.9% |
| Median | 5.4% | 93.8% |
| Interquartile 25% (IQ1) | 2.7% | 89.5% |
| Interquartile 75% (IQ3) | 9.7% | 98.4% |
| Interquartile Range (IQR) | 7.0% | 8.9% |
| Standard Deviation (Sample) | 14.7% | 14.0% |
| Standard Deviation (Population) | 14.5% | 13.8% |
Correlation Details
| Immigrants from Ukraine Percentile | Sample Size | 1 or more Vehicles in Household |
[ 0.0% - 0.5% ] 0.080% | 215,905,163 | 91.3% |
[ 0.0% - 0.5% ] 0.35% | 38,175,610 | 88.5% |
[ 0.5% - 1.0% ] 0.66% | 20,487,921 | 70.7% |
[ 0.5% - 1.0% ] 0.86% | 4,318,549 | 92.5% |
[ 1.0% - 1.5% ] 1.12% | 3,256,467 | 91.4% |
[ 1.0% - 1.5% ] 1.36% | 1,566,456 | 90.5% |
[ 1.5% - 2.0% ] 1.62% | 1,363,828 | 91.7% |
[ 1.5% - 2.0% ] 1.88% | 1,082,207 | 91.2% |
[ 2.0% - 2.5% ] 2.16% | 613,802 | 92.9% |
[ 2.0% - 2.5% ] 2.37% | 486,492 | 93.8% |
[ 2.5% - 3.0% ] 2.61% | 368,009 | 94.2% |
[ 2.5% - 3.0% ] 2.89% | 228,394 | 81.7% |
[ 3.0% - 3.5% ] 3.10% | 386,897 | 94.2% |
[ 3.0% - 3.5% ] 3.35% | 104,155 | 94.1% |
[ 3.5% - 4.0% ] 3.59% | 75,880 | 85.7% |
[ 3.5% - 4.0% ] 3.92% | 74,825 | 95.9% |
[ 4.0% - 4.5% ] 4.11% | 128,262 | 64.5% |
[ 4.0% - 4.5% ] 4.38% | 119,686 | 64.5% |
[ 4.5% - 5.0% ] 4.60% | 106,622 | 57.9% |
[ 4.5% - 5.0% ] 4.93% | 55,615 | 94.9% |
[ 5.0% - 5.5% ] 5.12% | 116,296 | 93.7% |
[ 5.0% - 5.5% ] 5.27% | 83,452 | 95.4% |
[ 5.5% - 6.0% ] 5.62% | 169,690 | 93.8% |
[ 5.5% - 6.0% ] 5.91% | 91,635 | 64.4% |
[ 6.0% - 6.5% ] 6.14% | 4,479 | 100.0% |
[ 6.0% - 6.5% ] 6.46% | 89,424 | 93.8% |
[ 6.5% - 7.0% ] 6.52% | 47,698 | 97.7% |
[ 7.0% - 7.5% ] 7.05% | 1,007 | 100.0% |
[ 7.5% - 8.0% ] 7.72% | 1,463 | 99.3% |
[ 7.5% - 8.0% ] 7.88% | 1,370 | 100.0% |
[ 8.0% - 8.5% ] 8.31% | 8,388 | 91.8% |
[ 8.5% - 9.0% ] 8.90% | 1,168 | 98.3% |
[ 9.0% - 9.5% ] 9.22% | 900 | 100.0% |
[ 10.0% - 10.5% ] 10.19% | 648 | 79.0% |
[ 10.5% - 11.0% ] 10.77% | 492 | 99.0% |
[ 11.0% - 11.5% ] 11.18% | 152 | 100.0% |
[ 11.5% - 12.0% ] 11.56% | 744 | 93.7% |
[ 13.5% - 14.0% ] 13.63% | 47,893 | 44.2% |
[ 13.5% - 14.0% ] 13.87% | 382 | 98.4% |
[ 15.0% - 15.5% ] 15.48% | 84,933 | 53.4% |
[ 16.0% - 16.5% ] 16.50% | 491 | 100.0% |
[ 19.5% - 20.0% ] 19.67% | 300 | 94.8% |
[ 50.0% - 50.5% ] 50.00% | 42 | 100.0% |
[ 88.5% - 89.0% ] 88.89% | 27 | 100.0% |