Egyptian 1 or more Vehicles in Household
COMPARE
Egyptian
Select to Compare
1 or more Vehicles in Household
Egyptian 1 or more Vehicles in Household
88.2%
1+ VEHICLES AVAILABLE
1.2/ 100
METRIC RATING
250th/ 347
METRIC RANK
Egyptian 1 or more Vehicles in Household Correlation Chart
The statistical analysis conducted on geographies consisting of 276,665,499 people shows a moderate positive correlation between the proportion of Egyptians and percentage of households with 1 or more vehicles available in the United States with a correlation coefficient (R) of 0.447 and weighted average of 88.2%. On average, for every 1% (one percent) increase in Egyptians within a typical geography, there is an increase of 0.49% in percentage of households with 1 or more vehicles available.
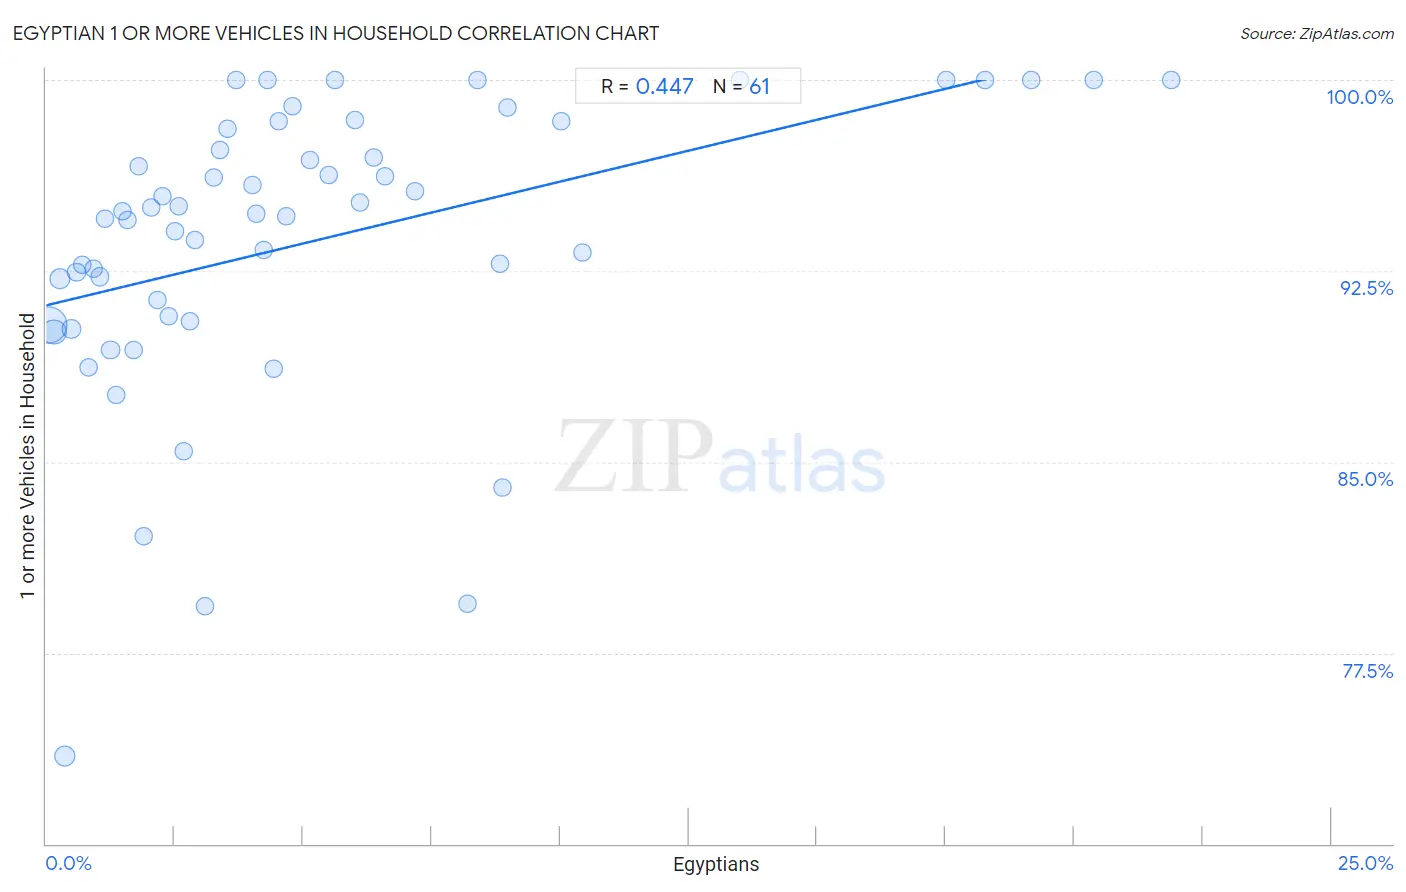
It is essential to understand that the correlation between the percentage of Egyptians and percentage of households with 1 or more vehicles available does not imply a direct cause-and-effect relationship. It remains uncertain whether the presence of Egyptians influences an upward or downward trend in the level of percentage of households with 1 or more vehicles available within an area, or if Egyptians simply ended up residing in those areas with higher or lower levels of percentage of households with 1 or more vehicles available due to other factors.
Demographics Similar to Egyptians by 1 or more Vehicles in Household
In terms of 1 or more vehicles in household, the demographic groups most similar to Egyptians are Immigrants from Serbia (88.2%, a difference of 0.010%), Black/African American (88.2%, a difference of 0.040%), Immigrants from Uruguay (88.1%, a difference of 0.060%), Immigrants from Nigeria (88.2%, a difference of 0.090%), and Honduran (88.1%, a difference of 0.10%).
| Demographics | Rating | Rank | 1 or more Vehicles in Household |
| Immigrants from Belgium | 2.1 /100 | #243 | Tragic 88.4% |
| Immigrants from Portugal | 2.0 /100 | #244 | Tragic 88.3% |
| Immigrants from Czechoslovakia | 1.9 /100 | #245 | Tragic 88.3% |
| Menominee | 1.9 /100 | #246 | Tragic 88.3% |
| Immigrants from Honduras | 1.7 /100 | #247 | Tragic 88.3% |
| Immigrants from Nigeria | 1.5 /100 | #248 | Tragic 88.2% |
| Blacks/African Americans | 1.4 /100 | #249 | Tragic 88.2% |
| Egyptians | 1.2 /100 | #250 | Tragic 88.2% |
| Immigrants from Serbia | 1.2 /100 | #251 | Tragic 88.2% |
| Immigrants from Uruguay | 1.1 /100 | #252 | Tragic 88.1% |
| Hondurans | 1.0 /100 | #253 | Tragic 88.1% |
| Haitians | 0.9 /100 | #254 | Tragic 88.1% |
| Immigrants from Latvia | 0.9 /100 | #255 | Tragic 88.1% |
| Colombians | 0.9 /100 | #256 | Tragic 88.0% |
| Liberians | 0.9 /100 | #257 | Tragic 88.0% |
Egyptian 1 or more Vehicles in Household Correlation Summary
| Measurement | Egyptian Data | 1 or more Vehicles in Household Data |
| Minimum | 0.048% | 73.5% |
| Maximum | 21.9% | 100.0% |
| Range | 21.8% | 26.5% |
| Mean | 5.2% | 93.7% |
| Median | 3.5% | 94.7% |
| Interquartile 25% (IQ1) | 1.6% | 90.6% |
| Interquartile 75% (IQ3) | 6.5% | 98.2% |
| Interquartile Range (IQR) | 4.8% | 7.6% |
| Standard Deviation (Sample) | 5.2% | 5.7% |
| Standard Deviation (Population) | 5.2% | 5.6% |
Correlation Details
| Egyptian Percentile | Sample Size | 1 or more Vehicles in Household |
[ 0.0% - 0.5% ] 0.048% | 148,552,991 | 90.4% |
[ 0.0% - 0.5% ] 0.16% | 57,317,577 | 90.1% |
[ 0.0% - 0.5% ] 0.27% | 20,122,206 | 92.2% |
[ 0.0% - 0.5% ] 0.36% | 22,779,786 | 73.5% |
[ 0.0% - 0.5% ] 0.49% | 7,449,280 | 90.2% |
[ 0.5% - 1.0% ] 0.60% | 4,831,139 | 92.5% |
[ 0.5% - 1.0% ] 0.70% | 3,225,676 | 92.7% |
[ 0.5% - 1.0% ] 0.82% | 2,417,282 | 88.7% |
[ 0.5% - 1.0% ] 0.93% | 1,797,091 | 92.6% |
[ 1.0% - 1.5% ] 1.04% | 1,983,146 | 92.3% |
[ 1.0% - 1.5% ] 1.14% | 855,863 | 94.6% |
[ 1.0% - 1.5% ] 1.25% | 676,576 | 89.4% |
[ 1.0% - 1.5% ] 1.35% | 775,907 | 87.6% |
[ 1.0% - 1.5% ] 1.48% | 391,296 | 94.8% |
[ 1.5% - 2.0% ] 1.59% | 416,568 | 94.5% |
[ 1.5% - 2.0% ] 1.69% | 513,256 | 89.4% |
[ 1.5% - 2.0% ] 1.80% | 290,694 | 96.6% |
[ 1.5% - 2.0% ] 1.89% | 742,845 | 82.1% |
[ 2.0% - 2.5% ] 2.04% | 262,183 | 95.0% |
[ 2.0% - 2.5% ] 2.16% | 122,258 | 91.4% |
[ 2.0% - 2.5% ] 2.27% | 28,023 | 95.5% |
[ 2.0% - 2.5% ] 2.37% | 77,570 | 90.7% |
[ 2.5% - 3.0% ] 2.51% | 9,255 | 94.0% |
[ 2.5% - 3.0% ] 2.58% | 159,607 | 95.0% |
[ 2.5% - 3.0% ] 2.66% | 145,756 | 85.4% |
[ 2.5% - 3.0% ] 2.79% | 96,434 | 90.5% |
[ 2.5% - 3.0% ] 2.90% | 3,965 | 93.7% |
[ 3.0% - 3.5% ] 3.10% | 113,952 | 79.3% |
[ 3.0% - 3.5% ] 3.25% | 9,596 | 96.2% |
[ 3.0% - 3.5% ] 3.38% | 5,444 | 97.2% |
[ 3.5% - 4.0% ] 3.53% | 18,086 | 98.1% |
[ 3.5% - 4.0% ] 3.70% | 81 | 100.0% |
[ 4.0% - 4.5% ] 4.01% | 5,835 | 95.9% |
[ 4.0% - 4.5% ] 4.09% | 60,303 | 94.7% |
[ 4.0% - 4.5% ] 4.22% | 13,070 | 93.3% |
[ 4.0% - 4.5% ] 4.32% | 533 | 100.0% |
[ 4.0% - 4.5% ] 4.44% | 36,823 | 88.6% |
[ 4.5% - 5.0% ] 4.52% | 155 | 98.4% |
[ 4.5% - 5.0% ] 4.67% | 52,230 | 94.6% |
[ 4.5% - 5.0% ] 4.79% | 4,782 | 99.0% |
[ 5.0% - 5.5% ] 5.13% | 99,800 | 96.9% |
[ 5.0% - 5.5% ] 5.49% | 601 | 96.3% |
[ 5.5% - 6.0% ] 5.61% | 659 | 100.0% |
[ 5.5% - 6.0% ] 5.99% | 3,553 | 98.4% |
[ 6.0% - 6.5% ] 6.10% | 6,952 | 95.2% |
[ 6.0% - 6.5% ] 6.36% | 14,518 | 97.0% |
[ 6.5% - 7.0% ] 6.59% | 8,410 | 96.2% |
[ 7.0% - 7.5% ] 7.17% | 7,017 | 95.6% |
[ 8.0% - 8.5% ] 8.20% | 140,994 | 79.4% |
[ 8.0% - 8.5% ] 8.40% | 750 | 100.0% |
[ 8.5% - 9.0% ] 8.83% | 1,155 | 92.8% |
[ 8.5% - 9.0% ] 8.89% | 1,429 | 84.0% |
[ 8.5% - 9.0% ] 8.97% | 747 | 98.9% |
[ 10.0% - 10.5% ] 10.02% | 5,751 | 98.4% |
[ 10.0% - 10.5% ] 10.44% | 5,000 | 93.2% |
[ 13.0% - 13.5% ] 13.49% | 1,394 | 100.0% |
[ 17.0% - 17.5% ] 17.50% | 120 | 100.0% |
[ 18.0% - 18.5% ] 18.26% | 241 | 100.0% |
[ 19.0% - 19.5% ] 19.16% | 981 | 100.0% |
[ 20.0% - 20.5% ] 20.38% | 211 | 100.0% |
[ 21.5% - 22.0% ] 21.88% | 96 | 100.0% |