Immigrants from Australia 1 or more Vehicles in Household
COMPARE
Immigrants from Australia
Select to Compare
1 or more Vehicles in Household
Immigrants from Australia 1 or more Vehicles in Household
86.4%
1+ VEHICLES AVAILABLE
0.0/ 100
METRIC RATING
290th/ 347
METRIC RANK
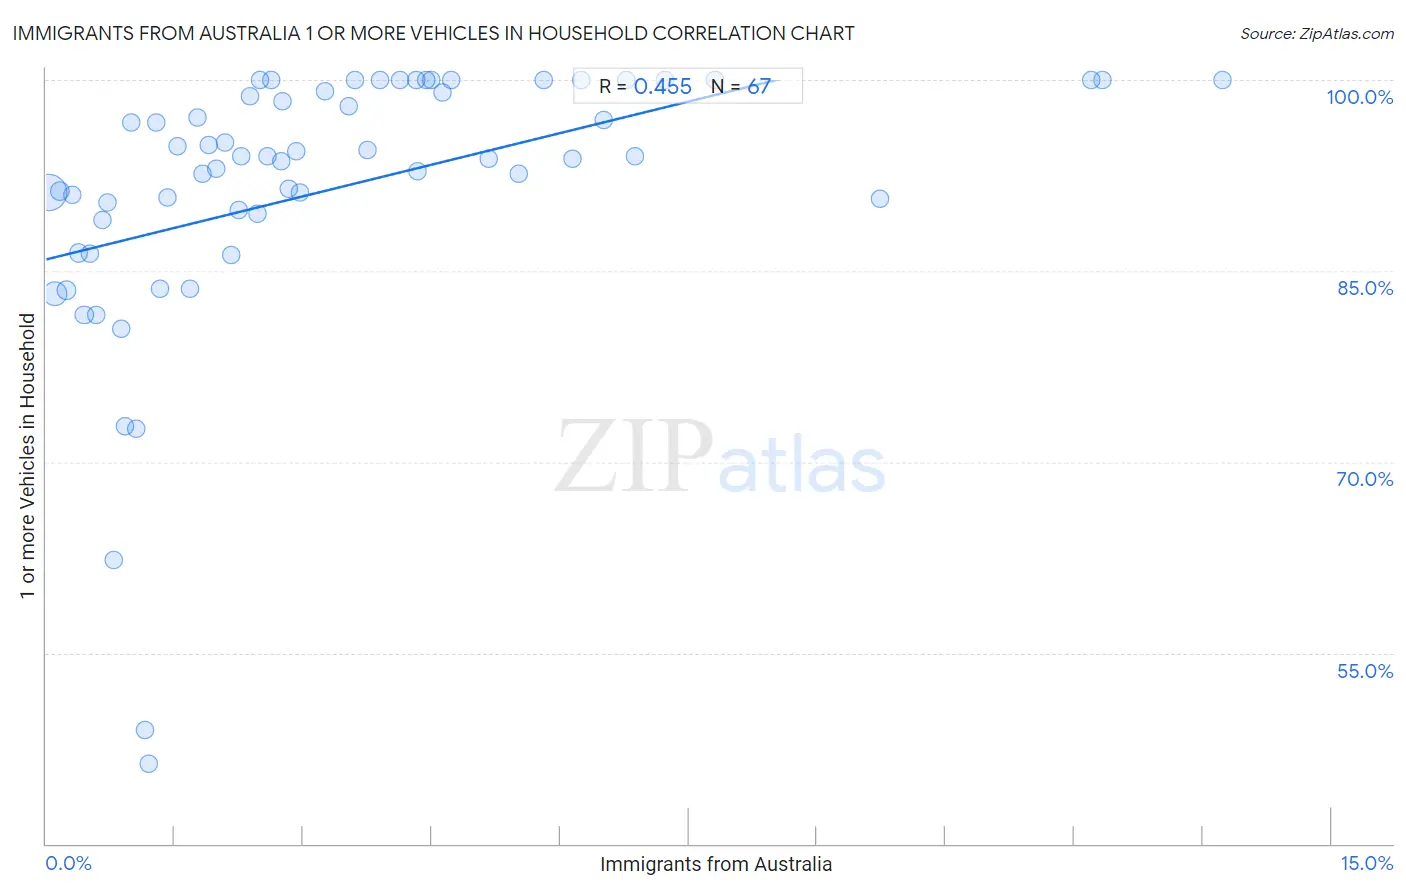
Immigrants from Australia 1 or more Vehicles in Household Correlation Chart
The statistical analysis conducted on geographies consisting of 227,104,870 people shows a moderate positive correlation between the proportion of Immigrants from Australia and percentage of households with 1 or more vehicles available in the United States with a correlation coefficient (R) of 0.455 and weighted average of 86.4%. On average, for every 1% (one percent) increase in Immigrants from Australia within a typical geography, there is an increase of 1.7% in percentage of households with 1 or more vehicles available.
It is essential to understand that the correlation between the percentage of Immigrants from Australia and percentage of households with 1 or more vehicles available does not imply a direct cause-and-effect relationship. It remains uncertain whether the presence of Immigrants from Australia influences an upward or downward trend in the level of percentage of households with 1 or more vehicles available within an area, or if Immigrants from Australia simply ended up residing in those areas with higher or lower levels of percentage of households with 1 or more vehicles available due to other factors.
Demographics Similar to Immigrants from Australia by 1 or more Vehicles in Household
In terms of 1 or more vehicles in household, the demographic groups most similar to Immigrants from Australia are Immigrants from Ireland (86.4%, a difference of 0.040%), Hopi (86.4%, a difference of 0.060%), Pima (86.3%, a difference of 0.080%), Immigrants from Malaysia (86.5%, a difference of 0.13%), and Immigrants from Eastern Asia (86.5%, a difference of 0.21%).
| Demographics | Rating | Rank | 1 or more Vehicles in Household |
| Immigrants from Eastern Europe | 0.0 /100 | #283 | Tragic 86.7% |
| Central American Indians | 0.0 /100 | #284 | Tragic 86.7% |
| Immigrants from Kazakhstan | 0.0 /100 | #285 | Tragic 86.6% |
| Immigrants from Eastern Asia | 0.0 /100 | #286 | Tragic 86.5% |
| Immigrants from Malaysia | 0.0 /100 | #287 | Tragic 86.5% |
| Hopi | 0.0 /100 | #288 | Tragic 86.4% |
| Immigrants from Ireland | 0.0 /100 | #289 | Tragic 86.4% |
| Immigrants from Australia | 0.0 /100 | #290 | Tragic 86.4% |
| Pima | 0.0 /100 | #291 | Tragic 86.3% |
| Okinawans | 0.0 /100 | #292 | Tragic 86.1% |
| Indians (Asian) | 0.0 /100 | #293 | Tragic 86.0% |
| Alaskan Athabascans | 0.0 /100 | #294 | Tragic 86.0% |
| Immigrants from Jamaica | 0.0 /100 | #295 | Tragic 85.8% |
| Immigrants from Spain | 0.0 /100 | #296 | Tragic 85.8% |
| Paraguayans | 0.0 /100 | #297 | Tragic 85.7% |
Immigrants from Australia 1 or more Vehicles in Household Correlation Summary
| Measurement | Immigrants from Australia Data | 1 or more Vehicles in Household Data |
| Minimum | 0.030% | 46.3% |
| Maximum | 13.7% | 100.0% |
| Range | 13.7% | 53.7% |
| Mean | 3.3% | 91.4% |
| Median | 2.5% | 94.0% |
| Interquartile 25% (IQ1) | 1.1% | 89.4% |
| Interquartile 75% (IQ3) | 4.5% | 100.0% |
| Interquartile Range (IQR) | 3.4% | 10.6% |
| Standard Deviation (Sample) | 3.0% | 10.9% |
| Standard Deviation (Population) | 3.0% | 10.8% |
Correlation Details
| Immigrants from Australia Percentile | Sample Size | 1 or more Vehicles in Household |
[ 0.0% - 0.5% ] 0.030% | 148,063,259 | 91.1% |
[ 0.0% - 0.5% ] 0.099% | 50,271,938 | 83.2% |
[ 0.0% - 0.5% ] 0.16% | 12,172,988 | 91.2% |
[ 0.0% - 0.5% ] 0.24% | 6,398,949 | 83.5% |
[ 0.0% - 0.5% ] 0.31% | 2,830,571 | 91.0% |
[ 0.0% - 0.5% ] 0.37% | 2,571,340 | 86.4% |
[ 0.0% - 0.5% ] 0.44% | 1,333,564 | 81.6% |
[ 0.5% - 1.0% ] 0.51% | 1,080,603 | 86.3% |
[ 0.5% - 1.0% ] 0.58% | 790,062 | 81.5% |
[ 0.5% - 1.0% ] 0.66% | 361,433 | 89.0% |
[ 0.5% - 1.0% ] 0.72% | 233,921 | 90.4% |
[ 0.5% - 1.0% ] 0.78% | 279,099 | 62.3% |
[ 0.5% - 1.0% ] 0.87% | 99,023 | 80.5% |
[ 0.5% - 1.0% ] 0.92% | 105,890 | 72.8% |
[ 0.5% - 1.0% ] 0.99% | 78,810 | 96.7% |
[ 1.0% - 1.5% ] 1.05% | 17,671 | 72.6% |
[ 1.0% - 1.5% ] 1.15% | 90,145 | 49.0% |
[ 1.0% - 1.5% ] 1.20% | 87,490 | 46.3% |
[ 1.0% - 1.5% ] 1.28% | 38,149 | 96.7% |
[ 1.0% - 1.5% ] 1.32% | 43,537 | 83.6% |
[ 1.0% - 1.5% ] 1.41% | 16,222 | 90.8% |
[ 1.5% - 2.0% ] 1.54% | 2,209 | 94.8% |
[ 1.5% - 2.0% ] 1.67% | 6,993 | 83.6% |
[ 1.5% - 2.0% ] 1.76% | 7,662 | 97.1% |
[ 1.5% - 2.0% ] 1.82% | 29,517 | 92.6% |
[ 1.5% - 2.0% ] 1.89% | 10,661 | 94.9% |
[ 1.5% - 2.0% ] 1.99% | 2,668 | 93.0% |
[ 2.0% - 2.5% ] 2.08% | 528 | 95.1% |
[ 2.0% - 2.5% ] 2.16% | 3,511 | 86.3% |
[ 2.0% - 2.5% ] 2.25% | 5,824 | 89.8% |
[ 2.0% - 2.5% ] 2.28% | 2,191 | 94.0% |
[ 2.0% - 2.5% ] 2.37% | 12,555 | 98.7% |
[ 2.0% - 2.5% ] 2.46% | 5,478 | 89.4% |
[ 2.0% - 2.5% ] 2.50% | 40 | 100.0% |
[ 2.5% - 3.0% ] 2.58% | 3,842 | 94.0% |
[ 2.5% - 3.0% ] 2.63% | 266 | 100.0% |
[ 2.5% - 3.0% ] 2.74% | 14,578 | 93.6% |
[ 2.5% - 3.0% ] 2.76% | 5,807 | 98.3% |
[ 2.5% - 3.0% ] 2.83% | 2,051 | 91.4% |
[ 2.5% - 3.0% ] 2.92% | 10,274 | 94.4% |
[ 2.5% - 3.0% ] 2.97% | 1,381 | 91.2% |
[ 3.0% - 3.5% ] 3.26% | 215 | 99.1% |
[ 3.5% - 4.0% ] 3.54% | 396 | 97.9% |
[ 3.5% - 4.0% ] 3.61% | 416 | 100.0% |
[ 3.5% - 4.0% ] 3.75% | 774 | 94.5% |
[ 3.5% - 4.0% ] 3.89% | 180 | 100.0% |
[ 4.0% - 4.5% ] 4.12% | 97 | 100.0% |
[ 4.0% - 4.5% ] 4.32% | 301 | 100.0% |
[ 4.0% - 4.5% ] 4.33% | 300 | 92.8% |
[ 4.0% - 4.5% ] 4.43% | 158 | 100.0% |
[ 4.0% - 4.5% ] 4.50% | 867 | 100.0% |
[ 4.5% - 5.0% ] 4.62% | 1,537 | 99.0% |
[ 4.5% - 5.0% ] 4.73% | 1,840 | 100.0% |
[ 5.0% - 5.5% ] 5.16% | 581 | 93.8% |
[ 5.5% - 6.0% ] 5.52% | 326 | 92.7% |
[ 5.5% - 6.0% ] 5.81% | 155 | 100.0% |
[ 6.0% - 6.5% ] 6.14% | 277 | 93.8% |
[ 6.0% - 6.5% ] 6.25% | 32 | 100.0% |
[ 6.5% - 7.0% ] 6.51% | 614 | 96.9% |
[ 6.5% - 7.0% ] 6.77% | 133 | 100.0% |
[ 6.5% - 7.0% ] 6.88% | 800 | 94.1% |
[ 7.0% - 7.5% ] 7.23% | 83 | 100.0% |
[ 7.5% - 8.0% ] 7.80% | 1,307 | 100.0% |
[ 9.5% - 10.0% ] 9.73% | 565 | 90.6% |
[ 12.0% - 12.5% ] 12.20% | 41 | 100.0% |
[ 12.0% - 12.5% ] 12.33% | 73 | 100.0% |
[ 13.5% - 14.0% ] 13.73% | 102 | 100.0% |