Welsh 1 or more Vehicles in Household
COMPARE
Welsh
Select to Compare
1 or more Vehicles in Household
Welsh 1 or more Vehicles in Household
93.0%
1+ VEHICLES AVAILABLE
100.0/ 100
METRIC RATING
18th/ 347
METRIC RANK
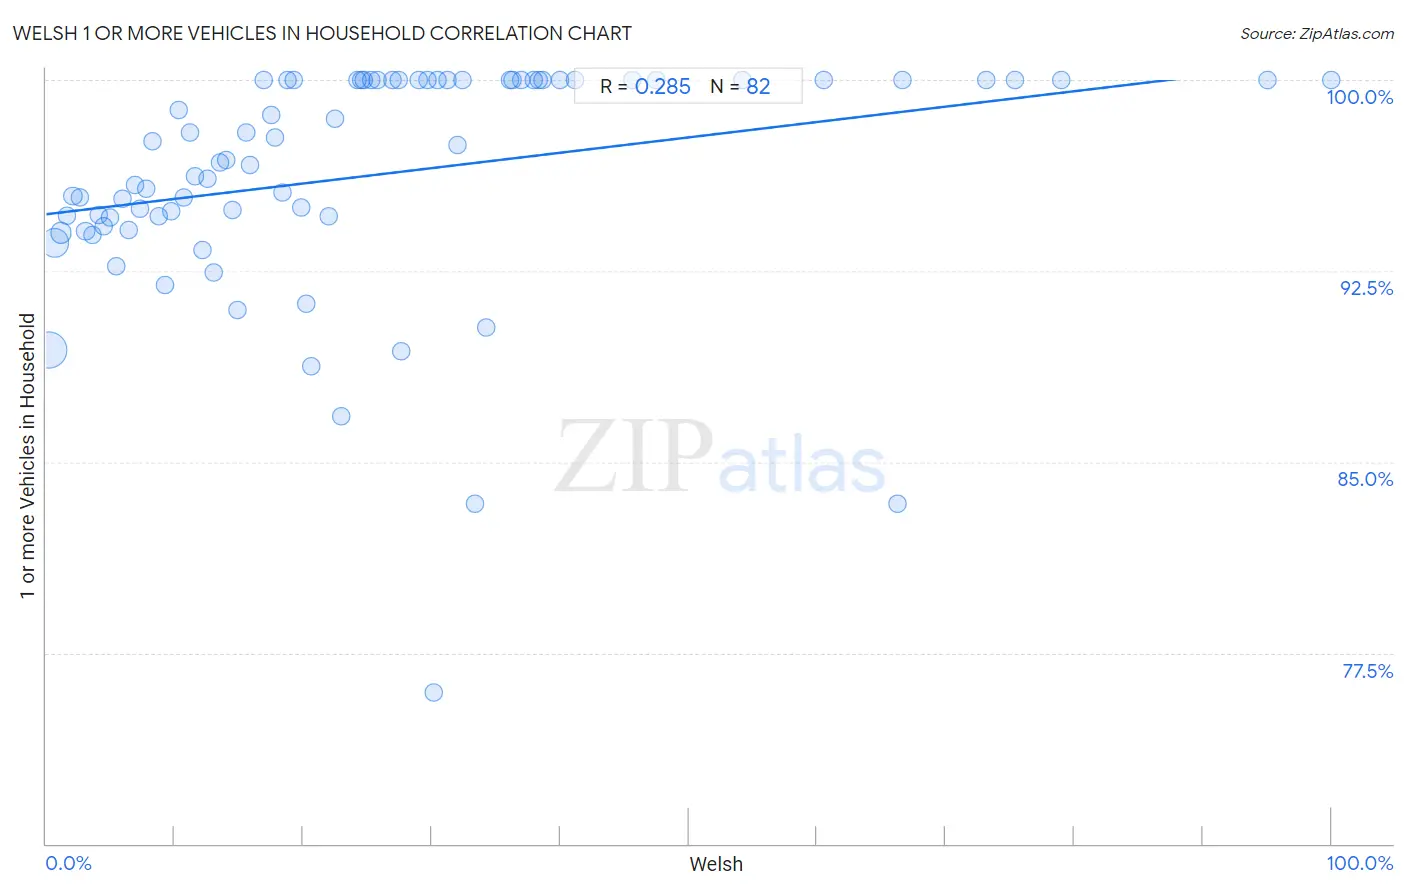
Welsh 1 or more Vehicles in Household Correlation Chart
The statistical analysis conducted on geographies consisting of 528,258,241 people shows a weak positive correlation between the proportion of Welsh and percentage of households with 1 or more vehicles available in the United States with a correlation coefficient (R) of 0.285 and weighted average of 93.0%. On average, for every 1% (one percent) increase in Welsh within a typical geography, there is an increase of 0.060% in percentage of households with 1 or more vehicles available.
It is essential to understand that the correlation between the percentage of Welsh and percentage of households with 1 or more vehicles available does not imply a direct cause-and-effect relationship. It remains uncertain whether the presence of Welsh influences an upward or downward trend in the level of percentage of households with 1 or more vehicles available within an area, or if Welsh simply ended up residing in those areas with higher or lower levels of percentage of households with 1 or more vehicles available due to other factors.
Demographics Similar to Welsh by 1 or more Vehicles in Household
In terms of 1 or more vehicles in household, the demographic groups most similar to Welsh are European (93.0%, a difference of 0.040%), Mexican (93.0%, a difference of 0.060%), Assyrian/Chaldean/Syriac (93.0%, a difference of 0.060%), Irish (93.1%, a difference of 0.080%), and White/Caucasian (93.1%, a difference of 0.12%).
| Demographics | Rating | Rank | 1 or more Vehicles in Household |
| Czechs | 100.0 /100 | #11 | Exceptional 93.3% |
| Scandinavians | 100.0 /100 | #12 | Exceptional 93.1% |
| Whites/Caucasians | 100.0 /100 | #13 | Exceptional 93.1% |
| Irish | 100.0 /100 | #14 | Exceptional 93.1% |
| Mexicans | 100.0 /100 | #15 | Exceptional 93.0% |
| Assyrians/Chaldeans/Syriacs | 100.0 /100 | #16 | Exceptional 93.0% |
| Europeans | 100.0 /100 | #17 | Exceptional 93.0% |
| Welsh | 100.0 /100 | #18 | Exceptional 93.0% |
| Tongans | 100.0 /100 | #19 | Exceptional 92.9% |
| Arapaho | 100.0 /100 | #20 | Exceptional 92.7% |
| Ottawa | 100.0 /100 | #21 | Exceptional 92.7% |
| French | 100.0 /100 | #22 | Exceptional 92.7% |
| Nepalese | 100.0 /100 | #23 | Exceptional 92.6% |
| Yaqui | 100.0 /100 | #24 | Exceptional 92.6% |
| Immigrants from Iraq | 100.0 /100 | #25 | Exceptional 92.5% |
Welsh 1 or more Vehicles in Household Correlation Summary
| Measurement | Welsh Data | 1 or more Vehicles in Household Data |
| Minimum | 0.24% | 75.9% |
| Maximum | 100.0% | 100.0% |
| Range | 99.8% | 24.1% |
| Mean | 25.2% | 96.3% |
| Median | 20.0% | 97.1% |
| Interquartile 25% (IQ1) | 9.7% | 94.6% |
| Interquartile 75% (IQ3) | 33.3% | 100.0% |
| Interquartile Range (IQR) | 23.6% | 5.4% |
| Standard Deviation (Sample) | 21.5% | 4.6% |
| Standard Deviation (Population) | 21.4% | 4.5% |
Correlation Details
| Welsh Percentile | Sample Size | 1 or more Vehicles in Household |
[ 0.0% - 0.5% ] 0.24% | 288,438,570 | 89.4% |
[ 0.5% - 1.0% ] 0.67% | 161,868,314 | 93.6% |
[ 1.0% - 1.5% ] 1.13% | 48,042,922 | 94.0% |
[ 1.5% - 2.0% ] 1.62% | 15,836,026 | 94.7% |
[ 2.0% - 2.5% ] 2.09% | 6,562,455 | 95.4% |
[ 2.5% - 3.0% ] 2.59% | 3,362,177 | 95.4% |
[ 3.0% - 3.5% ] 3.06% | 1,344,925 | 94.0% |
[ 3.5% - 4.0% ] 3.56% | 903,563 | 93.9% |
[ 4.0% - 4.5% ] 4.04% | 444,484 | 94.7% |
[ 4.0% - 4.5% ] 4.49% | 289,000 | 94.3% |
[ 4.5% - 5.0% ] 4.97% | 362,589 | 94.6% |
[ 5.0% - 5.5% ] 5.46% | 207,114 | 92.7% |
[ 5.5% - 6.0% ] 5.92% | 109,681 | 95.3% |
[ 6.0% - 6.5% ] 6.40% | 98,270 | 94.1% |
[ 6.5% - 7.0% ] 6.90% | 70,615 | 95.9% |
[ 7.0% - 7.5% ] 7.32% | 55,136 | 94.9% |
[ 7.5% - 8.0% ] 7.80% | 61,055 | 95.7% |
[ 8.0% - 8.5% ] 8.29% | 21,606 | 97.6% |
[ 8.5% - 9.0% ] 8.75% | 20,608 | 94.6% |
[ 9.0% - 9.5% ] 9.26% | 18,655 | 91.9% |
[ 9.5% - 10.0% ] 9.75% | 20,812 | 94.9% |
[ 10.0% - 10.5% ] 10.27% | 11,045 | 98.8% |
[ 10.5% - 11.0% ] 10.71% | 10,394 | 95.4% |
[ 11.0% - 11.5% ] 11.17% | 5,701 | 97.9% |
[ 11.5% - 12.0% ] 11.62% | 14,416 | 96.2% |
[ 12.0% - 12.5% ] 12.20% | 14,364 | 93.3% |
[ 12.5% - 13.0% ] 12.54% | 3,580 | 96.1% |
[ 12.5% - 13.0% ] 13.00% | 2,439 | 92.4% |
[ 13.0% - 13.5% ] 13.47% | 7,763 | 96.8% |
[ 13.5% - 14.0% ] 14.00% | 5,359 | 96.8% |
[ 14.5% - 15.0% ] 14.53% | 8,208 | 94.9% |
[ 14.5% - 15.0% ] 14.88% | 2,372 | 91.0% |
[ 15.5% - 16.0% ] 15.53% | 3,813 | 97.9% |
[ 15.5% - 16.0% ] 15.85% | 2,751 | 96.7% |
[ 16.5% - 17.0% ] 16.90% | 1,544 | 100.0% |
[ 17.5% - 18.0% ] 17.50% | 1,097 | 98.6% |
[ 17.5% - 18.0% ] 17.83% | 1,856 | 97.8% |
[ 18.0% - 18.5% ] 18.43% | 9,039 | 95.6% |
[ 18.5% - 19.0% ] 18.78% | 181 | 100.0% |
[ 19.0% - 19.5% ] 19.24% | 577 | 100.0% |
[ 19.5% - 20.0% ] 19.81% | 429 | 95.0% |
[ 20.0% - 20.5% ] 20.28% | 143 | 91.2% |
[ 20.5% - 21.0% ] 20.62% | 2,119 | 88.7% |
[ 22.0% - 22.5% ] 22.02% | 2,130 | 94.7% |
[ 22.5% - 23.0% ] 22.52% | 3,033 | 98.5% |
[ 22.5% - 23.0% ] 22.92% | 144 | 86.8% |
[ 24.0% - 24.5% ] 24.19% | 62 | 100.0% |
[ 24.5% - 25.0% ] 24.56% | 562 | 100.0% |
[ 24.5% - 25.0% ] 24.74% | 97 | 100.0% |
[ 25.0% - 25.5% ] 25.33% | 75 | 100.0% |
[ 25.5% - 26.0% ] 25.78% | 287 | 100.0% |
[ 26.5% - 27.0% ] 26.94% | 386 | 100.0% |
[ 27.0% - 27.5% ] 27.43% | 175 | 100.0% |
[ 27.5% - 28.0% ] 27.62% | 105 | 89.3% |
[ 29.0% - 29.5% ] 29.00% | 231 | 100.0% |
[ 29.5% - 30.0% ] 29.69% | 229 | 100.0% |
[ 30.0% - 30.5% ] 30.12% | 83 | 75.9% |
[ 30.0% - 30.5% ] 30.48% | 105 | 100.0% |
[ 31.0% - 31.5% ] 31.21% | 173 | 100.0% |
[ 32.0% - 32.5% ] 32.05% | 390 | 97.5% |
[ 32.0% - 32.5% ] 32.43% | 37 | 100.0% |
[ 33.0% - 33.5% ] 33.33% | 36 | 83.3% |
[ 34.0% - 34.5% ] 34.23% | 222 | 90.3% |
[ 36.0% - 36.5% ] 36.05% | 172 | 100.0% |
[ 36.0% - 36.5% ] 36.31% | 179 | 100.0% |
[ 36.5% - 37.0% ] 36.96% | 46 | 100.0% |
[ 37.5% - 38.0% ] 37.93% | 58 | 100.0% |
[ 38.0% - 38.5% ] 38.33% | 120 | 100.0% |
[ 38.5% - 39.0% ] 38.58% | 197 | 100.0% |
[ 40.0% - 40.5% ] 40.00% | 15 | 100.0% |
[ 41.0% - 41.5% ] 41.11% | 90 | 100.0% |
[ 45.5% - 46.0% ] 45.65% | 46 | 100.0% |
[ 47.0% - 47.5% ] 47.47% | 375 | 100.0% |
[ 54.0% - 54.5% ] 54.17% | 24 | 100.0% |
[ 60.0% - 60.5% ] 60.47% | 43 | 100.0% |
[ 66.0% - 66.5% ] 66.25% | 240 | 83.3% |
[ 66.5% - 67.0% ] 66.67% | 3 | 100.0% |
[ 73.0% - 73.5% ] 73.17% | 41 | 100.0% |
[ 75.0% - 75.5% ] 75.38% | 65 | 100.0% |
[ 79.0% - 79.5% ] 79.01% | 81 | 100.0% |
[ 95.0% - 95.5% ] 95.00% | 100 | 100.0% |
[ 99.5% - 100.0% ] 100.00% | 17 | 100.0% |