Laotian 1 or more Vehicles in Household
COMPARE
Laotian
Select to Compare
1 or more Vehicles in Household
Laotian 1 or more Vehicles in Household
91.0%
1+ VEHICLES AVAILABLE
98.0/ 100
METRIC RATING
105th/ 347
METRIC RANK
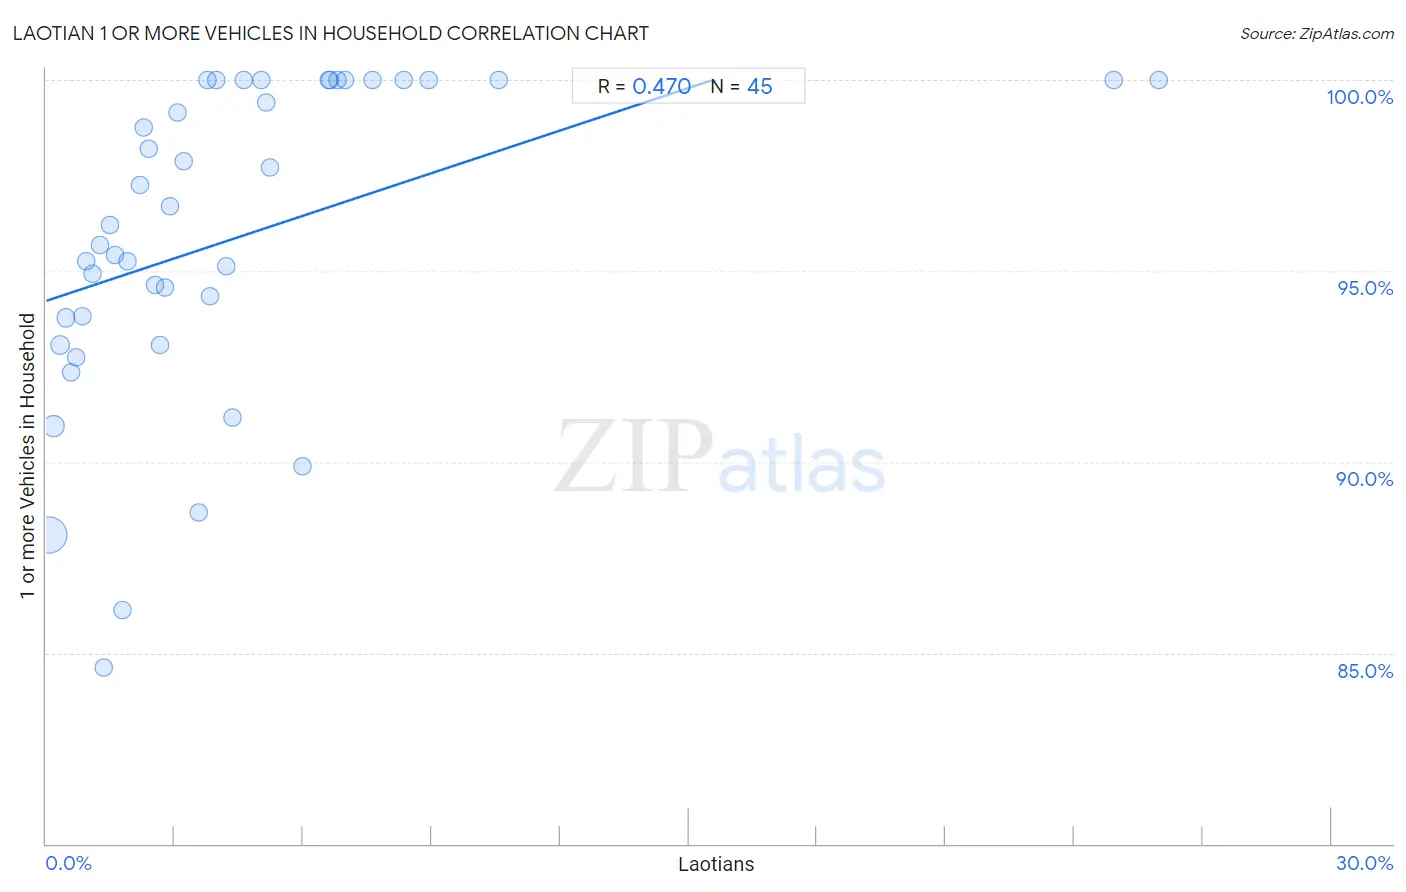
Laotian 1 or more Vehicles in Household Correlation Chart
The statistical analysis conducted on geographies consisting of 224,651,996 people shows a moderate positive correlation between the proportion of Laotians and percentage of households with 1 or more vehicles available in the United States with a correlation coefficient (R) of 0.470 and weighted average of 91.0%. On average, for every 1% (one percent) increase in Laotians within a typical geography, there is an increase of 0.37% in percentage of households with 1 or more vehicles available.
It is essential to understand that the correlation between the percentage of Laotians and percentage of households with 1 or more vehicles available does not imply a direct cause-and-effect relationship. It remains uncertain whether the presence of Laotians influences an upward or downward trend in the level of percentage of households with 1 or more vehicles available within an area, or if Laotians simply ended up residing in those areas with higher or lower levels of percentage of households with 1 or more vehicles available due to other factors.
Demographics Similar to Laotians by 1 or more Vehicles in Household
In terms of 1 or more vehicles in household, the demographic groups most similar to Laotians are Asian (91.1%, a difference of 0.040%), Zimbabwean (91.0%, a difference of 0.040%), Yugoslavian (91.1%, a difference of 0.060%), Maltese (91.0%, a difference of 0.060%), and Hispanic or Latino (91.0%, a difference of 0.060%).
| Demographics | Rating | Rank | 1 or more Vehicles in Household |
| Slavs | 98.7 /100 | #98 | Exceptional 91.2% |
| Immigrants from Bolivia | 98.6 /100 | #99 | Exceptional 91.2% |
| Immigrants from Central America | 98.4 /100 | #100 | Exceptional 91.1% |
| Bulgarians | 98.4 /100 | #101 | Exceptional 91.1% |
| Seminole | 98.3 /100 | #102 | Exceptional 91.1% |
| Yugoslavians | 98.3 /100 | #103 | Exceptional 91.1% |
| Asians | 98.2 /100 | #104 | Exceptional 91.1% |
| Laotians | 98.0 /100 | #105 | Exceptional 91.0% |
| Zimbabweans | 97.7 /100 | #106 | Exceptional 91.0% |
| Maltese | 97.7 /100 | #107 | Exceptional 91.0% |
| Hispanics or Latinos | 97.6 /100 | #108 | Exceptional 91.0% |
| Delaware | 97.6 /100 | #109 | Exceptional 91.0% |
| Mexican American Indians | 97.4 /100 | #110 | Exceptional 91.0% |
| Navajo | 95.8 /100 | #111 | Exceptional 90.8% |
| Immigrants from Netherlands | 95.7 /100 | #112 | Exceptional 90.8% |
Laotian 1 or more Vehicles in Household Correlation Summary
| Measurement | Laotian Data | 1 or more Vehicles in Household Data |
| Minimum | 0.051% | 84.6% |
| Maximum | 26.0% | 100.0% |
| Range | 25.9% | 15.4% |
| Mean | 4.5% | 95.9% |
| Median | 3.1% | 96.2% |
| Interquartile 25% (IQ1) | 1.4% | 93.4% |
| Interquartile 75% (IQ3) | 5.6% | 100.0% |
| Interquartile Range (IQR) | 4.2% | 6.6% |
| Standard Deviation (Sample) | 5.2% | 4.1% |
| Standard Deviation (Population) | 5.2% | 4.1% |
Correlation Details
| Laotian Percentile | Sample Size | 1 or more Vehicles in Household |
[ 0.0% - 0.5% ] 0.051% | 165,541,421 | 88.1% |
[ 0.0% - 0.5% ] 0.18% | 36,364,330 | 90.9% |
[ 0.0% - 0.5% ] 0.31% | 10,242,973 | 93.1% |
[ 0.0% - 0.5% ] 0.45% | 5,490,936 | 93.8% |
[ 0.5% - 1.0% ] 0.59% | 2,241,235 | 92.3% |
[ 0.5% - 1.0% ] 0.71% | 2,036,833 | 92.7% |
[ 0.5% - 1.0% ] 0.85% | 813,243 | 93.8% |
[ 0.5% - 1.0% ] 0.94% | 620,543 | 95.2% |
[ 1.0% - 1.5% ] 1.08% | 173,984 | 94.9% |
[ 1.0% - 1.5% ] 1.26% | 212,886 | 95.7% |
[ 1.0% - 1.5% ] 1.36% | 162,834 | 84.6% |
[ 1.0% - 1.5% ] 1.49% | 158,717 | 96.2% |
[ 1.5% - 2.0% ] 1.61% | 18,184 | 95.4% |
[ 1.5% - 2.0% ] 1.79% | 235,830 | 86.1% |
[ 1.5% - 2.0% ] 1.89% | 45,933 | 95.3% |
[ 2.0% - 2.5% ] 2.19% | 59,281 | 97.2% |
[ 2.0% - 2.5% ] 2.27% | 44,033 | 98.8% |
[ 2.0% - 2.5% ] 2.39% | 19,031 | 98.2% |
[ 2.5% - 3.0% ] 2.55% | 9,634 | 94.6% |
[ 2.5% - 3.0% ] 2.67% | 12,809 | 93.1% |
[ 2.5% - 3.0% ] 2.77% | 51,720 | 94.6% |
[ 2.5% - 3.0% ] 2.89% | 1,246 | 96.7% |
[ 3.0% - 3.5% ] 3.07% | 6,414 | 99.1% |
[ 3.0% - 3.5% ] 3.20% | 2,466 | 97.9% |
[ 3.5% - 4.0% ] 3.56% | 12,478 | 88.7% |
[ 3.5% - 4.0% ] 3.76% | 1,304 | 100.0% |
[ 3.5% - 4.0% ] 3.82% | 890 | 94.3% |
[ 3.5% - 4.0% ] 3.98% | 4,150 | 100.0% |
[ 4.0% - 4.5% ] 4.19% | 2,123 | 95.1% |
[ 4.0% - 4.5% ] 4.35% | 26,556 | 91.1% |
[ 4.5% - 5.0% ] 4.61% | 1,692 | 100.0% |
[ 5.0% - 5.5% ] 5.03% | 1,392 | 100.0% |
[ 5.0% - 5.5% ] 5.12% | 722 | 99.4% |
[ 5.0% - 5.5% ] 5.21% | 2,052 | 97.7% |
[ 5.5% - 6.0% ] 5.98% | 23,842 | 89.9% |
[ 6.5% - 7.0% ] 6.58% | 319 | 100.0% |
[ 6.5% - 7.0% ] 6.62% | 302 | 100.0% |
[ 6.5% - 7.0% ] 6.79% | 619 | 100.0% |
[ 6.5% - 7.0% ] 6.97% | 2,756 | 100.0% |
[ 7.5% - 8.0% ] 7.63% | 236 | 100.0% |
[ 8.0% - 8.5% ] 8.33% | 84 | 100.0% |
[ 8.5% - 9.0% ] 8.94% | 1,634 | 100.0% |
[ 10.5% - 11.0% ] 10.57% | 1,220 | 100.0% |
[ 24.5% - 25.0% ] 24.91% | 566 | 100.0% |
[ 25.5% - 26.0% ] 25.97% | 543 | 100.0% |