Immigrants from South Africa 1 or more Vehicles in Household
COMPARE
Immigrants from South Africa
Select to Compare
1 or more Vehicles in Household
Immigrants from South Africa 1 or more Vehicles in Household
90.4%
1+ VEHICLES AVAILABLE
88.1/ 100
METRIC RATING
132nd/ 347
METRIC RANK
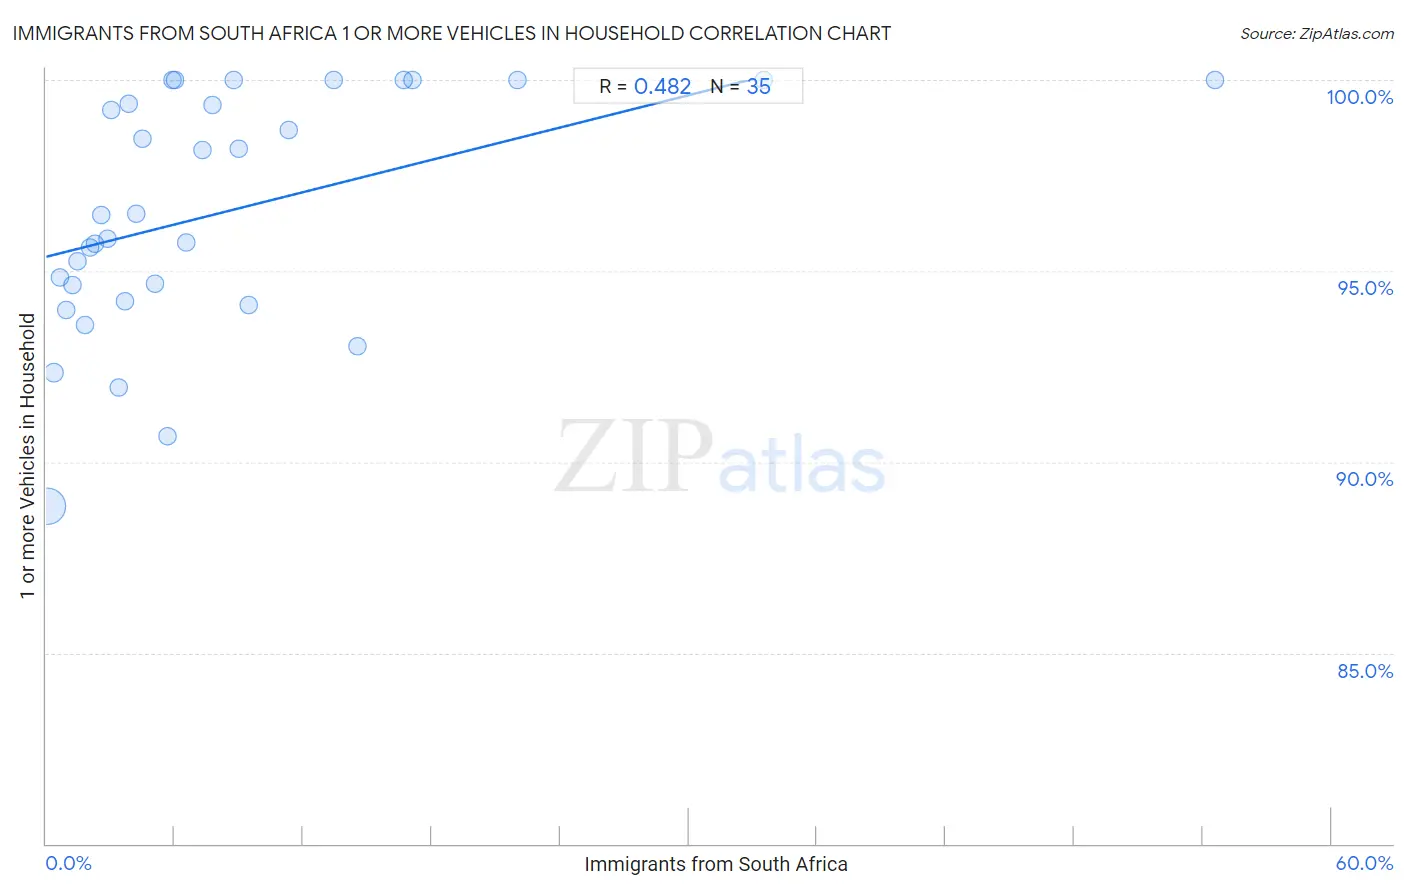
Immigrants from South Africa 1 or more Vehicles in Household Correlation Chart
The statistical analysis conducted on geographies consisting of 233,272,245 people shows a moderate positive correlation between the proportion of Immigrants from South Africa and percentage of households with 1 or more vehicles available in the United States with a correlation coefficient (R) of 0.482 and weighted average of 90.4%. On average, for every 1% (one percent) increase in Immigrants from South Africa within a typical geography, there is an increase of 0.14% in percentage of households with 1 or more vehicles available.
It is essential to understand that the correlation between the percentage of Immigrants from South Africa and percentage of households with 1 or more vehicles available does not imply a direct cause-and-effect relationship. It remains uncertain whether the presence of Immigrants from South Africa influences an upward or downward trend in the level of percentage of households with 1 or more vehicles available within an area, or if Immigrants from South Africa simply ended up residing in those areas with higher or lower levels of percentage of households with 1 or more vehicles available due to other factors.
Demographics Similar to Immigrants from South Africa by 1 or more Vehicles in Household
In terms of 1 or more vehicles in household, the demographic groups most similar to Immigrants from South Africa are Immigrants from Kenya (90.4%, a difference of 0.010%), Immigrants from Syria (90.4%, a difference of 0.020%), Burmese (90.4%, a difference of 0.030%), Marshallese (90.4%, a difference of 0.030%), and Nicaraguan (90.4%, a difference of 0.030%).
| Demographics | Rating | Rank | 1 or more Vehicles in Household |
| Immigrants from Korea | 90.5 /100 | #125 | Exceptional 90.5% |
| Immigrants from Cameroon | 89.4 /100 | #126 | Excellent 90.4% |
| Immigrants from the Azores | 89.1 /100 | #127 | Excellent 90.4% |
| Burmese | 89.0 /100 | #128 | Excellent 90.4% |
| Marshallese | 88.9 /100 | #129 | Excellent 90.4% |
| Nicaraguans | 88.8 /100 | #130 | Excellent 90.4% |
| Immigrants from Kenya | 88.5 /100 | #131 | Excellent 90.4% |
| Immigrants from South Africa | 88.1 /100 | #132 | Excellent 90.4% |
| Immigrants from Syria | 87.5 /100 | #133 | Excellent 90.4% |
| Kenyans | 87.0 /100 | #134 | Excellent 90.4% |
| Immigrants from Oceania | 86.9 /100 | #135 | Excellent 90.4% |
| Hungarians | 86.5 /100 | #136 | Excellent 90.3% |
| Latvians | 86.3 /100 | #137 | Excellent 90.3% |
| Syrians | 86.3 /100 | #138 | Excellent 90.3% |
| Estonians | 85.6 /100 | #139 | Excellent 90.3% |
Immigrants from South Africa 1 or more Vehicles in Household Correlation Summary
| Measurement | Immigrants from South Africa Data | 1 or more Vehicles in Household Data |
| Minimum | 0.064% | 88.8% |
| Maximum | 54.5% | 100.0% |
| Range | 54.5% | 11.2% |
| Mean | 8.4% | 96.6% |
| Median | 5.1% | 96.5% |
| Interquartile 25% (IQ1) | 2.3% | 94.2% |
| Interquartile 75% (IQ3) | 9.5% | 100.0% |
| Interquartile Range (IQR) | 7.2% | 5.8% |
| Standard Deviation (Sample) | 10.7% | 3.1% |
| Standard Deviation (Population) | 10.5% | 3.1% |
Correlation Details
| Immigrants from South Africa Percentile | Sample Size | 1 or more Vehicles in Household |
[ 0.0% - 0.5% ] 0.064% | 219,872,368 | 88.8% |
[ 0.0% - 0.5% ] 0.37% | 10,328,872 | 92.3% |
[ 0.5% - 1.0% ] 0.66% | 1,527,597 | 94.8% |
[ 0.5% - 1.0% ] 0.94% | 802,725 | 94.0% |
[ 1.0% - 1.5% ] 1.22% | 309,874 | 94.6% |
[ 1.0% - 1.5% ] 1.49% | 219,091 | 95.3% |
[ 1.5% - 2.0% ] 1.79% | 28,972 | 93.6% |
[ 2.0% - 2.5% ] 2.04% | 41,917 | 95.6% |
[ 2.0% - 2.5% ] 2.26% | 24,418 | 95.7% |
[ 2.5% - 3.0% ] 2.58% | 17,228 | 96.5% |
[ 2.5% - 3.0% ] 2.86% | 10,344 | 95.9% |
[ 3.0% - 3.5% ] 3.05% | 29,649 | 99.2% |
[ 3.0% - 3.5% ] 3.37% | 3,852 | 92.0% |
[ 3.5% - 4.0% ] 3.69% | 4,151 | 94.2% |
[ 3.5% - 4.0% ] 3.84% | 25,869 | 99.4% |
[ 4.0% - 4.5% ] 4.20% | 3,859 | 96.5% |
[ 4.0% - 4.5% ] 4.47% | 3,694 | 98.5% |
[ 5.0% - 5.5% ] 5.08% | 1,339 | 94.7% |
[ 5.5% - 6.0% ] 5.65% | 1,132 | 90.7% |
[ 5.5% - 6.0% ] 5.92% | 152 | 100.0% |
[ 6.0% - 6.5% ] 6.02% | 83 | 100.0% |
[ 6.5% - 7.0% ] 6.53% | 3,908 | 95.8% |
[ 7.0% - 7.5% ] 7.31% | 5,790 | 98.2% |
[ 7.5% - 8.0% ] 7.75% | 1,588 | 99.3% |
[ 8.5% - 9.0% ] 8.76% | 251 | 100.0% |
[ 9.0% - 9.5% ] 9.01% | 744 | 98.2% |
[ 9.0% - 9.5% ] 9.47% | 190 | 94.1% |
[ 11.0% - 11.5% ] 11.31% | 778 | 98.7% |
[ 13.0% - 13.5% ] 13.44% | 253 | 100.0% |
[ 14.5% - 15.0% ] 14.52% | 496 | 93.0% |
[ 16.5% - 17.0% ] 16.67% | 36 | 100.0% |
[ 17.0% - 17.5% ] 17.11% | 532 | 100.0% |
[ 22.0% - 22.5% ] 22.01% | 309 | 100.0% |
[ 33.5% - 34.0% ] 33.53% | 173 | 100.0% |
[ 54.5% - 55.0% ] 54.55% | 11 | 100.0% |