Asian 1 or more Vehicles in Household
COMPARE
Asian
Select to Compare
1 or more Vehicles in Household
Asian 1 or more Vehicles in Household
91.1%
1+ VEHICLES AVAILABLE
98.2/ 100
METRIC RATING
104th/ 347
METRIC RANK
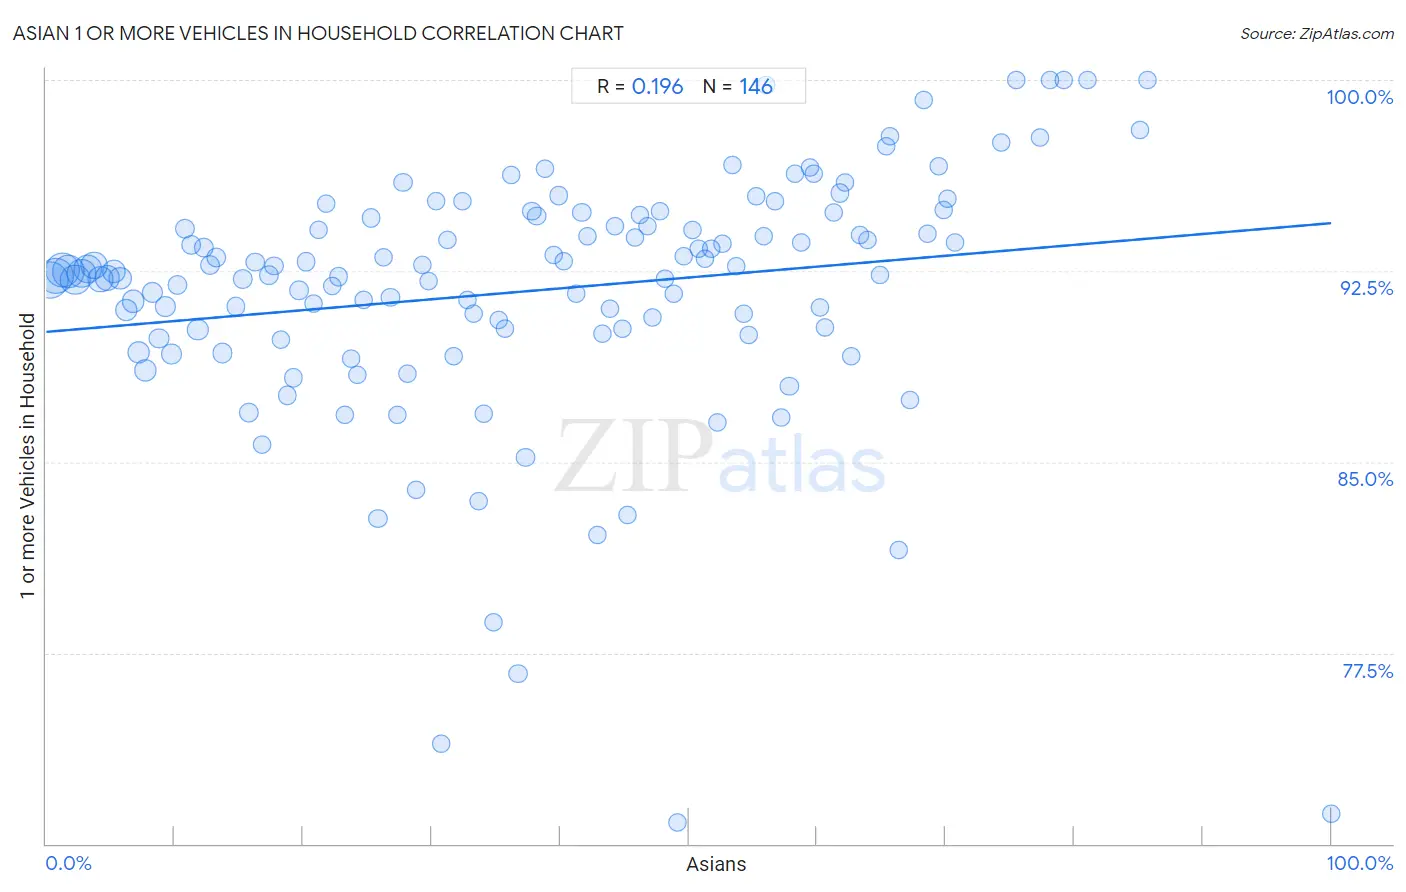
Asian 1 or more Vehicles in Household Correlation Chart
The statistical analysis conducted on geographies consisting of 538,010,988 people shows a poor positive correlation between the proportion of Asians and percentage of households with 1 or more vehicles available in the United States with a correlation coefficient (R) of 0.196 and weighted average of 91.1%. On average, for every 1% (one percent) increase in Asians within a typical geography, there is an increase of 0.043% in percentage of households with 1 or more vehicles available.
It is essential to understand that the correlation between the percentage of Asians and percentage of households with 1 or more vehicles available does not imply a direct cause-and-effect relationship. It remains uncertain whether the presence of Asians influences an upward or downward trend in the level of percentage of households with 1 or more vehicles available within an area, or if Asians simply ended up residing in those areas with higher or lower levels of percentage of households with 1 or more vehicles available due to other factors.
Demographics Similar to Asians by 1 or more Vehicles in Household
In terms of 1 or more vehicles in household, the demographic groups most similar to Asians are Yugoslavian (91.1%, a difference of 0.010%), Seminole (91.1%, a difference of 0.020%), Bulgarian (91.1%, a difference of 0.040%), Laotian (91.0%, a difference of 0.040%), and Immigrants from Central America (91.1%, a difference of 0.050%).
| Demographics | Rating | Rank | 1 or more Vehicles in Household |
| Pakistanis | 99.0 /100 | #97 | Exceptional 91.3% |
| Slavs | 98.7 /100 | #98 | Exceptional 91.2% |
| Immigrants from Bolivia | 98.6 /100 | #99 | Exceptional 91.2% |
| Immigrants from Central America | 98.4 /100 | #100 | Exceptional 91.1% |
| Bulgarians | 98.4 /100 | #101 | Exceptional 91.1% |
| Seminole | 98.3 /100 | #102 | Exceptional 91.1% |
| Yugoslavians | 98.3 /100 | #103 | Exceptional 91.1% |
| Asians | 98.2 /100 | #104 | Exceptional 91.1% |
| Laotians | 98.0 /100 | #105 | Exceptional 91.0% |
| Zimbabweans | 97.7 /100 | #106 | Exceptional 91.0% |
| Maltese | 97.7 /100 | #107 | Exceptional 91.0% |
| Hispanics or Latinos | 97.6 /100 | #108 | Exceptional 91.0% |
| Delaware | 97.6 /100 | #109 | Exceptional 91.0% |
| Mexican American Indians | 97.4 /100 | #110 | Exceptional 91.0% |
| Navajo | 95.8 /100 | #111 | Exceptional 90.8% |
Asian 1 or more Vehicles in Household Correlation Summary
| Measurement | Asian Data | 1 or more Vehicles in Household Data |
| Minimum | 0.26% | 70.8% |
| Maximum | 100.0% | 100.0% |
| Range | 99.7% | 29.2% |
| Mean | 37.8% | 91.7% |
| Median | 37.0% | 92.4% |
| Interquartile 25% (IQ1) | 18.7% | 90.2% |
| Interquartile 75% (IQ3) | 55.9% | 94.6% |
| Interquartile Range (IQR) | 37.1% | 4.4% |
| Standard Deviation (Sample) | 22.8% | 5.0% |
| Standard Deviation (Population) | 22.7% | 4.9% |
Correlation Details
| Asian Percentile | Sample Size | 1 or more Vehicles in Household |
[ 0.0% - 0.5% ] 0.26% | 53,786,531 | 92.1% |
[ 0.5% - 1.0% ] 0.74% | 52,428,091 | 92.3% |
[ 1.0% - 1.5% ] 1.25% | 46,652,253 | 92.5% |
[ 1.5% - 2.0% ] 1.74% | 41,562,212 | 92.5% |
[ 2.0% - 2.5% ] 2.25% | 34,184,980 | 92.1% |
[ 2.5% - 3.0% ] 2.73% | 31,075,448 | 92.4% |
[ 3.0% - 3.5% ] 3.24% | 27,618,172 | 92.6% |
[ 3.5% - 4.0% ] 3.73% | 22,994,581 | 92.7% |
[ 4.0% - 4.5% ] 4.21% | 18,698,045 | 92.2% |
[ 4.5% - 5.0% ] 4.73% | 19,029,002 | 92.2% |
[ 5.0% - 5.5% ] 5.26% | 13,502,233 | 92.5% |
[ 5.5% - 6.0% ] 5.75% | 13,299,350 | 92.2% |
[ 6.0% - 6.5% ] 6.23% | 10,561,219 | 91.0% |
[ 6.5% - 7.0% ] 6.76% | 14,156,197 | 91.3% |
[ 7.0% - 7.5% ] 7.18% | 11,639,492 | 89.3% |
[ 7.5% - 8.0% ] 7.71% | 8,602,550 | 88.6% |
[ 8.0% - 8.5% ] 8.27% | 7,557,913 | 91.7% |
[ 8.5% - 9.0% ] 8.76% | 5,632,567 | 89.9% |
[ 9.0% - 9.5% ] 9.25% | 5,229,296 | 91.1% |
[ 9.5% - 10.0% ] 9.75% | 5,640,534 | 89.2% |
[ 10.0% - 10.5% ] 10.25% | 3,931,358 | 92.0% |
[ 10.5% - 11.0% ] 10.76% | 3,941,469 | 94.2% |
[ 11.0% - 11.5% ] 11.24% | 4,224,651 | 93.5% |
[ 11.5% - 12.0% ] 11.79% | 8,672,681 | 90.2% |
[ 12.0% - 12.5% ] 12.27% | 3,121,067 | 93.4% |
[ 12.5% - 13.0% ] 12.72% | 3,379,925 | 92.7% |
[ 13.0% - 13.5% ] 13.26% | 3,612,961 | 93.0% |
[ 13.5% - 14.0% ] 13.74% | 4,011,406 | 89.3% |
[ 14.5% - 15.0% ] 14.77% | 2,109,356 | 91.1% |
[ 15.0% - 15.5% ] 15.27% | 2,021,927 | 92.2% |
[ 15.5% - 16.0% ] 15.78% | 3,031,691 | 87.0% |
[ 16.0% - 16.5% ] 16.23% | 2,375,996 | 92.8% |
[ 16.5% - 17.0% ] 16.79% | 2,262,727 | 85.7% |
[ 17.0% - 17.5% ] 17.31% | 2,602,366 | 92.3% |
[ 17.5% - 18.0% ] 17.71% | 2,012,124 | 92.7% |
[ 18.0% - 18.5% ] 18.28% | 2,038,653 | 89.8% |
[ 18.5% - 19.0% ] 18.74% | 1,267,772 | 87.6% |
[ 19.0% - 19.5% ] 19.25% | 2,083,226 | 88.3% |
[ 19.5% - 20.0% ] 19.68% | 1,857,416 | 91.7% |
[ 20.0% - 20.5% ] 20.25% | 957,945 | 92.9% |
[ 20.5% - 21.0% ] 20.80% | 1,156,092 | 91.2% |
[ 21.0% - 21.5% ] 21.20% | 1,001,149 | 94.1% |
[ 21.5% - 22.0% ] 21.75% | 500,723 | 95.1% |
[ 22.0% - 22.5% ] 22.26% | 1,513,920 | 91.9% |
[ 22.5% - 23.0% ] 22.73% | 1,219,067 | 92.3% |
[ 23.0% - 23.5% ] 23.26% | 801,151 | 86.9% |
[ 23.5% - 24.0% ] 23.75% | 723,144 | 89.0% |
[ 24.0% - 24.5% ] 24.25% | 783,836 | 88.4% |
[ 24.5% - 25.0% ] 24.70% | 687,428 | 91.4% |
[ 25.0% - 25.5% ] 25.28% | 977,438 | 94.6% |
[ 25.5% - 26.0% ] 25.80% | 1,135,455 | 82.8% |
[ 26.0% - 26.5% ] 26.26% | 1,021,425 | 93.0% |
[ 26.5% - 27.0% ] 26.78% | 898,024 | 91.5% |
[ 27.0% - 27.5% ] 27.30% | 800,639 | 86.9% |
[ 27.5% - 28.0% ] 27.76% | 458,221 | 96.0% |
[ 28.0% - 28.5% ] 28.15% | 399,530 | 88.4% |
[ 28.5% - 29.0% ] 28.77% | 846,994 | 83.9% |
[ 29.0% - 29.5% ] 29.25% | 632,025 | 92.7% |
[ 29.5% - 30.0% ] 29.75% | 875,991 | 92.1% |
[ 30.0% - 30.5% ] 30.33% | 681,741 | 95.2% |
[ 30.5% - 31.0% ] 30.69% | 314,432 | 73.9% |
[ 31.0% - 31.5% ] 31.25% | 435,356 | 93.7% |
[ 31.5% - 32.0% ] 31.70% | 354,466 | 89.2% |
[ 32.0% - 32.5% ] 32.36% | 283,359 | 95.2% |
[ 32.5% - 33.0% ] 32.75% | 379,325 | 91.3% |
[ 33.0% - 33.5% ] 33.24% | 510,629 | 90.8% |
[ 33.5% - 34.0% ] 33.68% | 515,682 | 83.5% |
[ 34.0% - 34.5% ] 34.06% | 110,219 | 86.9% |
[ 34.5% - 35.0% ] 34.79% | 1,325,296 | 78.7% |
[ 35.0% - 35.5% ] 35.24% | 335,763 | 90.6% |
[ 35.5% - 36.0% ] 35.71% | 538,620 | 90.2% |
[ 36.0% - 36.5% ] 36.17% | 140,910 | 96.3% |
[ 36.5% - 37.0% ] 36.72% | 483,172 | 76.7% |
[ 37.0% - 37.5% ] 37.30% | 562,986 | 85.2% |
[ 37.5% - 38.0% ] 37.79% | 446,356 | 94.9% |
[ 38.0% - 38.5% ] 38.17% | 1,332,443 | 94.7% |
[ 38.5% - 39.0% ] 38.79% | 217,104 | 96.5% |
[ 39.0% - 39.5% ] 39.47% | 244,422 | 93.1% |
[ 39.5% - 40.0% ] 39.89% | 299,666 | 95.5% |
[ 40.0% - 40.5% ] 40.27% | 156,576 | 92.9% |
[ 41.0% - 41.5% ] 41.20% | 214,066 | 91.6% |
[ 41.5% - 42.0% ] 41.68% | 558,810 | 94.8% |
[ 42.0% - 42.5% ] 42.12% | 123,436 | 93.9% |
[ 42.5% - 43.0% ] 42.85% | 178,995 | 82.1% |
[ 43.0% - 43.5% ] 43.29% | 292,241 | 90.0% |
[ 43.5% - 44.0% ] 43.84% | 213,582 | 91.0% |
[ 44.0% - 44.5% ] 44.29% | 406,566 | 94.3% |
[ 44.5% - 45.0% ] 44.80% | 142,721 | 90.2% |
[ 45.0% - 45.5% ] 45.22% | 61,578 | 82.9% |
[ 45.5% - 46.0% ] 45.82% | 31,392 | 93.8% |
[ 46.0% - 46.5% ] 46.23% | 74,176 | 94.7% |
[ 46.5% - 47.0% ] 46.76% | 187,302 | 94.2% |
[ 47.0% - 47.5% ] 47.19% | 195,881 | 90.7% |
[ 47.5% - 48.0% ] 47.75% | 135,081 | 94.9% |
[ 48.0% - 48.5% ] 48.13% | 228,738 | 92.2% |
[ 48.5% - 49.0% ] 48.80% | 149,573 | 91.6% |
[ 49.0% - 49.5% ] 49.17% | 268,981 | 70.8% |
[ 49.5% - 50.0% ] 49.63% | 209,739 | 93.1% |
[ 50.0% - 50.5% ] 50.33% | 156,457 | 94.1% |
[ 50.5% - 51.0% ] 50.75% | 223,066 | 93.4% |
[ 51.0% - 51.5% ] 51.31% | 193,613 | 93.0% |
[ 51.5% - 52.0% ] 51.77% | 120,112 | 93.4% |
[ 52.0% - 52.5% ] 52.26% | 550,031 | 86.6% |
[ 52.5% - 53.0% ] 52.62% | 86,202 | 93.6% |
[ 53.0% - 53.5% ] 53.39% | 179,366 | 96.7% |
[ 53.5% - 54.0% ] 53.74% | 168,493 | 92.7% |
[ 54.0% - 54.5% ] 54.31% | 156,175 | 90.8% |
[ 54.5% - 55.0% ] 54.70% | 178,510 | 90.0% |
[ 55.0% - 55.5% ] 55.23% | 68,476 | 95.4% |
[ 55.5% - 56.0% ] 55.87% | 195,849 | 93.9% |
[ 56.0% - 56.5% ] 56.01% | 16,722 | 99.8% |
[ 56.5% - 57.0% ] 56.73% | 21,402 | 95.2% |
[ 57.0% - 57.5% ] 57.17% | 94,153 | 86.8% |
[ 57.5% - 58.0% ] 57.83% | 68,242 | 88.0% |
[ 58.0% - 58.5% ] 58.24% | 134,842 | 96.3% |
[ 58.5% - 59.0% ] 58.79% | 229,316 | 93.6% |
[ 59.0% - 59.5% ] 59.41% | 93,745 | 96.5% |
[ 59.5% - 60.0% ] 59.77% | 43,886 | 96.3% |
[ 60.0% - 60.5% ] 60.23% | 187,009 | 91.1% |
[ 60.5% - 61.0% ] 60.60% | 153,666 | 90.3% |
[ 61.0% - 61.5% ] 61.27% | 132,470 | 94.8% |
[ 61.5% - 62.0% ] 61.81% | 265,452 | 95.6% |
[ 62.0% - 62.5% ] 62.16% | 21,929 | 96.0% |
[ 62.5% - 63.0% ] 62.67% | 166,706 | 89.1% |
[ 63.0% - 63.5% ] 63.32% | 59,151 | 93.9% |
[ 63.5% - 64.0% ] 63.93% | 59,410 | 93.7% |
[ 64.5% - 65.0% ] 64.88% | 101,367 | 92.3% |
[ 65.0% - 65.5% ] 65.39% | 117,012 | 97.4% |
[ 65.5% - 66.0% ] 65.67% | 64,377 | 97.8% |
[ 66.0% - 66.5% ] 66.31% | 4,185 | 81.5% |
[ 67.0% - 67.5% ] 67.23% | 40,134 | 87.4% |
[ 68.0% - 68.5% ] 68.31% | 25,001 | 99.2% |
[ 68.5% - 69.0% ] 68.56% | 39,565 | 94.0% |
[ 69.0% - 69.5% ] 69.44% | 8,835 | 96.6% |
[ 69.5% - 70.0% ] 69.85% | 219,899 | 94.9% |
[ 70.0% - 70.5% ] 70.18% | 68,801 | 95.3% |
[ 70.5% - 71.0% ] 70.74% | 57,900 | 93.6% |
[ 74.0% - 74.5% ] 74.33% | 37,671 | 97.5% |
[ 75.5% - 76.0% ] 75.52% | 2,549 | 100.0% |
[ 77.0% - 77.5% ] 77.32% | 53,464 | 97.8% |
[ 78.0% - 78.5% ] 78.09% | 178 | 100.0% |
[ 79.0% - 79.5% ] 79.14% | 954 | 100.0% |
[ 81.0% - 81.5% ] 81.03% | 116 | 100.0% |
[ 85.0% - 85.5% ] 85.11% | 2,996 | 98.0% |
[ 85.5% - 86.0% ] 85.71% | 42 | 100.0% |
[ 99.5% - 100.0% ] 100.00% | 475 | 71.2% |