Immigrants from Kuwait 1 or more Vehicles in Household

COMPARE

Immigrants from Kuwait
Race
Ancestry
AfghanAfricanAlaska NativeAlaskan AthabascanAlbanianAleutAlsatianAmericanApacheArabArapahoArgentineanArmenianAssyrian/Chaldean/SyriacAustralianAustrianBahamianBangladeshiBarbadianBasqueBelgianBelizeanBermudanBhutaneseBlackfeetBolivianBrazilianBritishBritish West IndianBulgarianBurmeseCajunCambodianCanadianCape VerdeanCarpatho RusynCelticCentral AmericanCentral American IndianCherokeeCheyenneChickasawChileanChineseChippewaChoctawColombianColvilleComancheCosta RicanCreeCreekCroatianCrowCubanCypriotCzechCzechoslovakianDanishDelawareDominicanDutchDutch West IndianEastern EuropeanEcuadorianEgyptianEnglishEstonianEthiopianEuropeanFijianFilipinoFinnishFrenchFrench American IndianFrench CanadianGermanGerman RussianGhanaianGreekGuamanian/ChamorroGuatemalanGuyaneseHaitianHmongHonduranHopiHoumaHungarianIcelanderIndian (Asian)IndonesianInupiatIranianIraqiIrishIroquoisIsraeliItalianJamaicanJapaneseJordanianKenyanKiowaKoreanLaotianLatvianLebaneseLiberianLithuanianLumbeeLuxembourgerMacedonianMalaysianMalteseMarshalleseMenomineeMexicanMexican American IndianMongolianMoroccanNative HawaiianNavajoNepaleseNew ZealanderNicaraguanNigerianNorthern EuropeanNorwegianOkinawanOsageOttawaPaiutePakistaniPalestinianPanamanianParaguayanPennsylvania GermanPeruvianPimaPolishPortuguesePotawatomiPuebloPuerto RicanPuget Sound SalishRomanianRussianSalvadoranSamoanScandinavianScotch-IrishScottishSeminoleSenegaleseSerbianShoshoneSierra LeoneanSiouxSlavicSlovakSloveneSomaliSouth AfricanSouth AmericanSouth American IndianSoviet UnionSpaniardSpanishSpanish AmericanSpanish American IndianSri LankanSubsaharan AfricanSudaneseSwedishSwissSyrianTaiwaneseThaiTlingit-HaidaTohono O'OdhamTonganTrinidadian and TobagonianTsimshianTurkishU.S. Virgin IslanderUgandanUkrainianUruguayanUteVenezuelanVietnameseWelshWest IndianYakamaYaquiYugoslavianYumanYup'ikZimbabwean
Immigration
NonimmigrantsImmigrantsAfghanistanAfricaAlbaniaArgentinaArmeniaAsiaAustraliaAustriaBahamasBangladeshBarbadosBelarusBelgiumBelizeBoliviaBosnia and HerzegovinaBrazilBulgariaBurma/MyanmarCabo VerdeCambodiaCameroonCanadaCaribbeanCentral AmericaChileChinaColombiaCongoCosta RicaCroatiaCubaCzechoslovakiaDenmarkDominicaDominican RepublicEastern AfricaEastern AsiaEastern EuropeEcuadorEgyptEl SalvadorEnglandEritreaEthiopiaEuropeFijiFranceGermanyGhanaGreeceGrenadaGuatemalaGuyanaHaitiHondurasHong KongHungaryIndiaIndonesiaIranIraqIrelandIsraelItalyJamaicaJapanJordanKazakhstanKenyaKoreaKuwaitLaosLatin AmericaLatviaLebanonLiberiaLithuaniaMalaysiaMexicoMicronesiaMiddle AfricaMoldovaMoroccoNepalNetherlandsNicaraguaNigeriaNorth AmericaNorth MacedoniaNorthern AfricaNorthern EuropeNorwayOceaniaPakistanPanamaPeruPhilippinesPolandPortugalRomaniaRussiaSaudi ArabiaScotlandSenegalSerbiaSierra LeoneSingaporeSomaliaSouth AfricaSouth AmericaSouth Central AsiaSouth Eastern AsiaSouthern EuropeSpainSri LankaSt. Vincent and the GrenadinesSudanSwedenSwitzerlandSyriaTaiwanThailandTrinidad and TobagoTurkeyUgandaUkraineUruguayUzbekistanVenezuelaVietnamWest IndiesWestern AfricaWestern AsiaWestern EuropeYemenZaireZimbabweAzores
Select to Compare
Race
Ancestry
AfghanAfricanAlaska NativeAlaskan AthabascanAlbanianAleutAlsatianAmericanApacheArabArapahoArgentineanArmenianAssyrian/Chaldean/SyriacAustralianAustrianBahamianBangladeshiBarbadianBasqueBelgianBelizeanBermudanBhutaneseBlackfeetBolivianBrazilianBritishBritish West IndianBulgarianBurmeseCajunCambodianCanadianCape VerdeanCarpatho RusynCelticCentral AmericanCentral American IndianCherokeeCheyenneChickasawChileanChineseChippewaChoctawColombianColvilleComancheCosta RicanCreeCreekCroatianCrowCubanCypriotCzechCzechoslovakianDanishDelawareDominicanDutchDutch West IndianEastern EuropeanEcuadorianEgyptianEnglishEstonianEthiopianEuropeanFijianFilipinoFinnishFrenchFrench American IndianFrench CanadianGermanGerman RussianGhanaianGreekGuamanian/ChamorroGuatemalanGuyaneseHaitianHmongHonduranHopiHoumaHungarianIcelanderIndian (Asian)IndonesianInupiatIranianIraqiIrishIroquoisIsraeliItalianJamaicanJapaneseJordanianKenyanKiowaKoreanLaotianLatvianLebaneseLiberianLithuanianLumbeeLuxembourgerMacedonianMalaysianMalteseMarshalleseMenomineeMexicanMexican American IndianMongolianMoroccanNative HawaiianNavajoNepaleseNew ZealanderNicaraguanNigerianNorthern EuropeanNorwegianOkinawanOsageOttawaPaiutePakistaniPalestinianPanamanianParaguayanPennsylvania GermanPeruvianPimaPolishPortuguesePotawatomiPuebloPuerto RicanPuget Sound SalishRomanianRussianSalvadoranSamoanScandinavianScotch-IrishScottishSeminoleSenegaleseSerbianShoshoneSierra LeoneanSiouxSlavicSlovakSloveneSomaliSouth AfricanSouth AmericanSouth American IndianSoviet UnionSpaniardSpanishSpanish AmericanSpanish American IndianSri LankanSubsaharan AfricanSudaneseSwedishSwissSyrianTaiwaneseThaiTlingit-HaidaTohono O'OdhamTonganTrinidadian and TobagonianTsimshianTurkishU.S. Virgin IslanderUgandanUkrainianUruguayanUteVenezuelanVietnameseWelshWest IndianYakamaYaquiYugoslavianYumanYup'ikZimbabwean
Immigration
NonimmigrantsImmigrantsAfghanistanAfricaAlbaniaArgentinaArmeniaAsiaAustraliaAustriaBahamasBangladeshBarbadosBelarusBelgiumBelizeBoliviaBosnia and HerzegovinaBrazilBulgariaBurma/MyanmarCabo VerdeCambodiaCameroonCanadaCaribbeanCentral AmericaChileChinaColombiaCongoCosta RicaCroatiaCubaCzechoslovakiaDenmarkDominicaDominican RepublicEastern AfricaEastern AsiaEastern EuropeEcuadorEgyptEl SalvadorEnglandEritreaEthiopiaEuropeFijiFranceGermanyGhanaGreeceGrenadaGuatemalaGuyanaHaitiHondurasHong KongHungaryIndiaIndonesiaIranIraqIrelandIsraelItalyJamaicaJapanJordanKazakhstanKenyaKoreaLaosLatin AmericaLatviaLebanonLiberiaLithuaniaMalaysiaMexicoMicronesiaMiddle AfricaMoldovaMoroccoNepalNetherlandsNicaraguaNigeriaNorth AmericaNorth MacedoniaNorthern AfricaNorthern EuropeNorwayOceaniaPakistanPanamaPeruPhilippinesPolandPortugalRomaniaRussiaSaudi ArabiaScotlandSenegalSerbiaSierra LeoneSingaporeSomaliaSouth AfricaSouth AmericaSouth Central AsiaSouth Eastern AsiaSouthern EuropeSpainSri LankaSt. Vincent and the GrenadinesSudanSwedenSwitzerlandSyriaTaiwanThailandTrinidad and TobagoTurkeyUgandaUkraineUruguayUzbekistanVenezuelaVietnamWest IndiesWestern AfricaWestern AsiaWestern EuropeYemenZaireZimbabweAzores
1 or more Vehicles in Household
Income
Poverty
Unemployment
Labor Participation
Family Structure
Vehicle Availability
Education Level
Disability

Immigrants from Kuwait 1 or more Vehicles in Household
Exceptional

90.7%
1+ VEHICLES AVAILABLE
94.7/ 100
METRIC RATING
113th/ 347
METRIC RANK

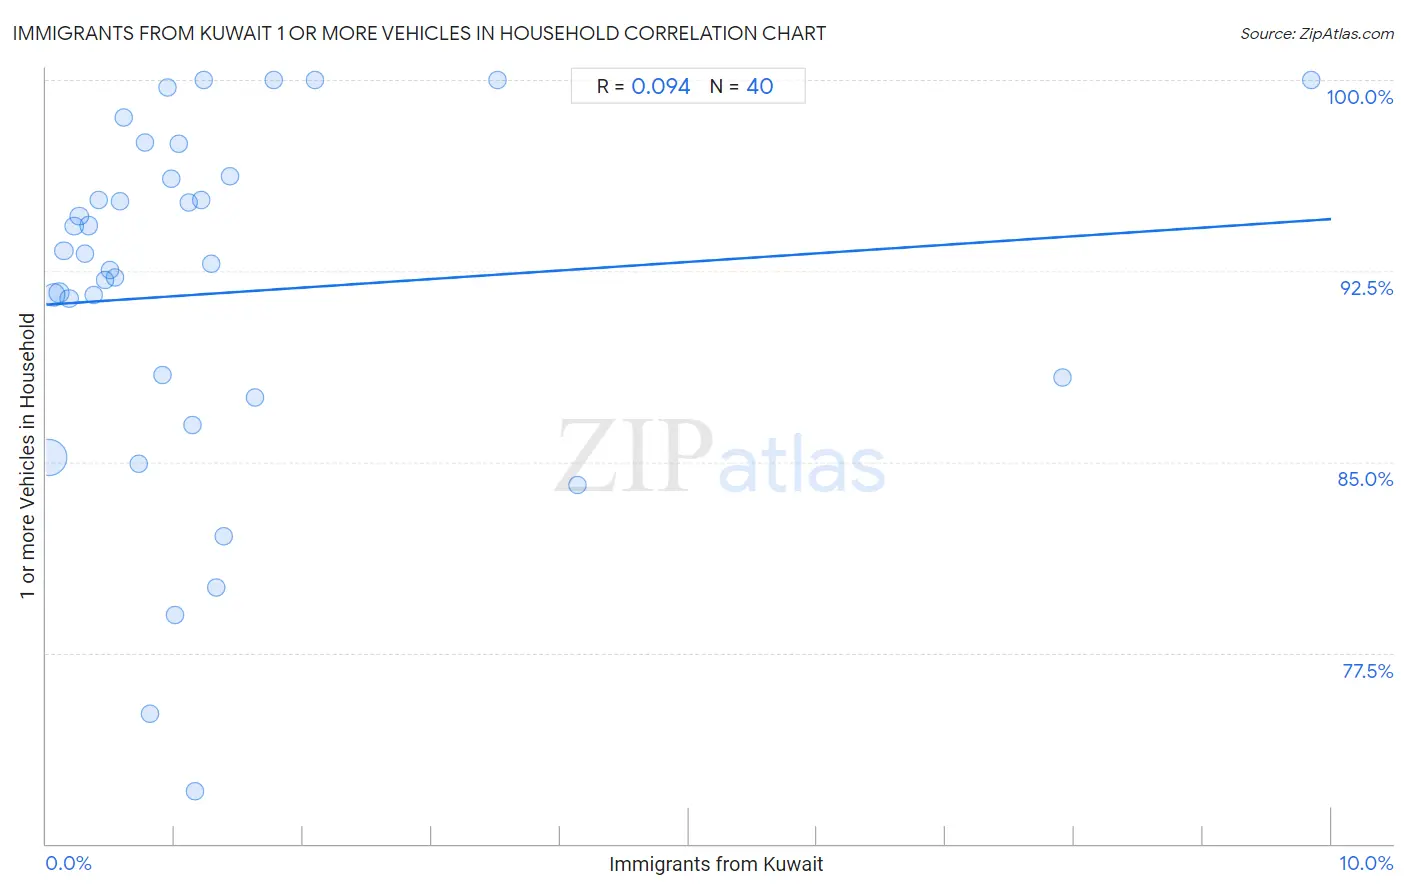
Immigrants from Kuwait 1 or more Vehicles in Household Correlation Chart

The statistical analysis conducted on geographies consisting of 136,852,839 people shows a slight positive correlation between the proportion of Immigrants from Kuwait and percentage of households with 1 or more vehicles available in the United States with a correlation coefficient (R) of 0.094 and weighted average of 90.7%. On average, for every 1% (one percent) increase in Immigrants from Kuwait within a typical geography, there is an increase of 0.34% in percentage of households with 1 or more vehicles available.
Immigrants from Kuwait 1 or more Vehicles in Household
It is essential to understand that the correlation between the percentage of Immigrants from Kuwait and percentage of households with 1 or more vehicles available does not imply a direct cause-and-effect relationship. It remains uncertain whether the presence of Immigrants from Kuwait influences an upward or downward trend in the level of percentage of households with 1 or more vehicles available within an area, or if Immigrants from Kuwait simply ended up residing in those areas with higher or lower levels of percentage of households with 1 or more vehicles available due to other factors.

Demographics Similar to Immigrants from Kuwait by 1 or more Vehicles in Household

In terms of 1 or more vehicles in household, the demographic groups most similar to Immigrants from Kuwait are Armenian (90.7%, a difference of 0.020%), Serbian (90.7%, a difference of 0.030%), Chippewa (90.7%, a difference of 0.030%), Immigrants from Netherlands (90.8%, a difference of 0.080%), and Navajo (90.8%, a difference of 0.090%).
DemographicsRating | Rank1 or more Vehicles in Household
Zimbabweans
97.7
/100
|
#106
Exceptional
91.0%
Maltese
97.7
/100
|
#107
Exceptional
91.0%
Hispanics or Latinos
97.6
/100
|
#108
Exceptional
91.0%
Delaware
97.6
/100
|
#109
Exceptional
91.0%
Mexican American Indians
97.4
/100
|
#110
Exceptional
91.0%
Navajo
95.8
/100
|
#111
Exceptional
90.8%
Immigrants from Netherlands
95.7
/100
|
#112
Exceptional
90.8%
Immigrants from Kuwait
94.7
/100
|
#113
Exceptional
90.7%
Armenians
94.5
/100
|
#114
Exceptional
90.7%
Serbians
94.3
/100
|
#115
Exceptional
90.7%
Chippewa
94.3
/100
|
#116
Exceptional
90.7%
Greeks
93.5
/100
|
#117
Exceptional
90.6%
Japanese
93.4
/100
|
#118
Exceptional
90.6%
Blackfeet
92.6
/100
|
#119
Exceptional
90.6%
Immigrants from Thailand
92.3
/100
|
#120
Exceptional
90.6%

Immigrants from Kuwait 1 or more Vehicles in Household Correlation Summary

MeasurementImmigrants from Kuwait Data1 or more Vehicles in Household Data
Minimum0.016%72.1%
Maximum9.8%100.0%
Range9.8%27.9%
Mean1.4%91.6%
Median0.92%93.0%
Interquartile 25% (IQ1)0.39%87.9%
Interquartile 75% (IQ3)1.3%96.2%
Interquartile Range (IQR)0.91%8.3%
Standard Deviation (Sample)1.9%7.0%
Standard Deviation (Population)1.9%6.9%

Correlation Details

Immigrants from Kuwait PercentileSample Size1 or more Vehicles in Household
[
0.0%
-
0.5%
]
0.016%
90,418,35385.2%
[
0.0%
-
0.5%
]
0.055%
25,048,98391.6%
[
0.0%
-
0.5%
]
0.098%
9,270,68091.6%
[
0.0%
-
0.5%
]
0.14%
4,653,47393.3%
[
0.0%
-
0.5%
]
0.18%
2,151,83091.4%
[
0.0%
-
0.5%
]
0.22%
1,590,43494.3%
[
0.0%
-
0.5%
]
0.26%
952,56694.7%
[
0.0%
-
0.5%
]
0.30%
634,98493.2%
[
0.0%
-
0.5%
]
0.33%
395,77094.3%
[
0.0%
-
0.5%
]
0.37%
344,86691.6%
[
0.0%
-
0.5%
]
0.41%
450,59195.3%
[
0.0%
-
0.5%
]
0.45%
176,78292.2%
[
0.5%
-
1.0%
]
0.50%
132,57192.5%
[
0.5%
-
1.0%
]
0.53%
141,22292.2%
[
0.5%
-
1.0%
]
0.57%
65,63295.2%
[
0.5%
-
1.0%
]
0.61%
42,36498.5%
[
0.5%
-
1.0%
]
0.72%
36,24384.9%
[
0.5%
-
1.0%
]
0.77%
21,79897.5%
[
0.5%
-
1.0%
]
0.81%
37,58375.1%
[
0.5%
-
1.0%
]
0.90%
25,13088.4%
[
0.5%
-
1.0%
]
0.94%
11,26599.7%
[
0.5%
-
1.0%
]
0.97%
43,06896.1%
[
1.0%
-
1.5%
]
1.01%
13,31579.0%
[
1.0%
-
1.5%
]
1.04%
8,40397.5%
[
1.0%
-
1.5%
]
1.11%
1,35795.2%
[
1.0%
-
1.5%
]
1.14%
30,22086.5%
[
1.0%
-
1.5%
]
1.16%
3,20072.1%
[
1.0%
-
1.5%
]
1.21%
21,34295.3%
[
1.0%
-
1.5%
]
1.23%
4,478100.0%
[
1.0%
-
1.5%
]
1.29%
3,41992.8%
[
1.0%
-
1.5%
]
1.32%
46,47380.1%
[
1.0%
-
1.5%
]
1.38%
5,20582.1%
[
1.0%
-
1.5%
]
1.43%
34,14896.2%
[
1.5%
-
2.0%
]
1.62%
26,70887.5%
[
1.5%
-
2.0%
]
1.77%
1,467100.0%
[
2.0%
-
2.5%
]
2.09%
1,244100.0%
[
3.5%
-
4.0%
]
3.52%
2,332100.0%
[
4.0%
-
4.5%
]
4.13%
2,41984.1%
[
7.5%
-
8.0%
]
7.90%
29188.3%
[
9.5%
-
10.0%
]
9.84%
630100.0%