Immigrants from Sweden 1 or more Vehicles in Household
COMPARE
Immigrants from Sweden
Select to Compare
1 or more Vehicles in Household
Immigrants from Sweden 1 or more Vehicles in Household
89.3%
1+ VEHICLES AVAILABLE
23.6/ 100
METRIC RATING
197th/ 347
METRIC RANK
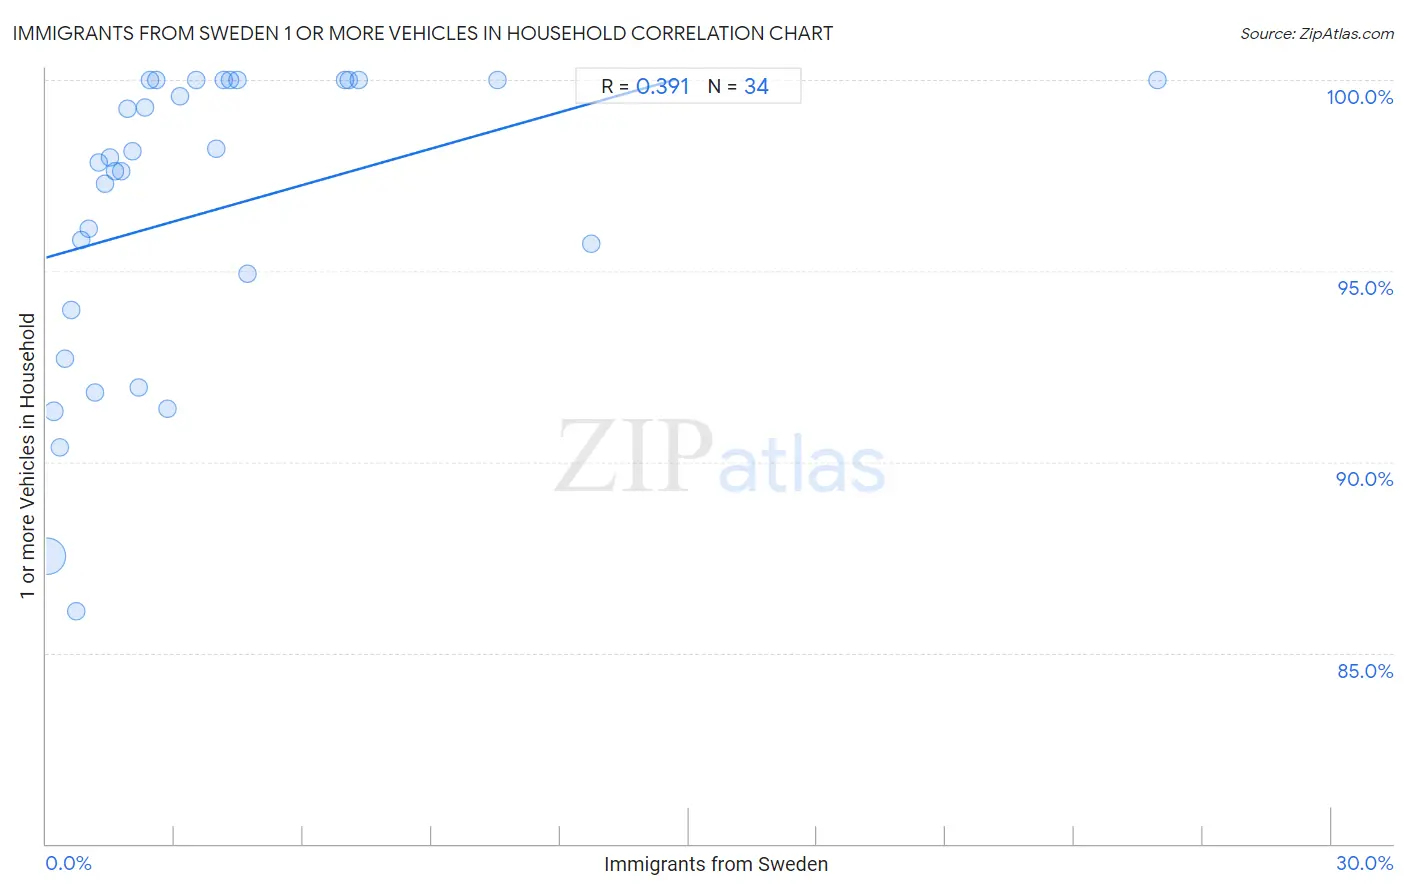
Immigrants from Sweden 1 or more Vehicles in Household Correlation Chart
The statistical analysis conducted on geographies consisting of 164,706,538 people shows a mild positive correlation between the proportion of Immigrants from Sweden and percentage of households with 1 or more vehicles available in the United States with a correlation coefficient (R) of 0.391 and weighted average of 89.3%. On average, for every 1% (one percent) increase in Immigrants from Sweden within a typical geography, there is an increase of 0.32% in percentage of households with 1 or more vehicles available.
It is essential to understand that the correlation between the percentage of Immigrants from Sweden and percentage of households with 1 or more vehicles available does not imply a direct cause-and-effect relationship. It remains uncertain whether the presence of Immigrants from Sweden influences an upward or downward trend in the level of percentage of households with 1 or more vehicles available within an area, or if Immigrants from Sweden simply ended up residing in those areas with higher or lower levels of percentage of households with 1 or more vehicles available due to other factors.
Demographics Similar to Immigrants from Sweden by 1 or more Vehicles in Household
In terms of 1 or more vehicles in household, the demographic groups most similar to Immigrants from Sweden are Crow (89.3%, a difference of 0.010%), Pennsylvania German (89.3%, a difference of 0.020%), Immigrants from Asia (89.3%, a difference of 0.020%), Central American (89.2%, a difference of 0.050%), and Immigrants from Western Europe (89.2%, a difference of 0.070%).
| Demographics | Rating | Rank | 1 or more Vehicles in Household |
| Shoshone | 37.5 /100 | #190 | Fair 89.5% |
| Immigrants from Poland | 37.1 /100 | #191 | Fair 89.5% |
| Immigrants from North Macedonia | 36.5 /100 | #192 | Fair 89.5% |
| Immigrants from Northern Europe | 35.5 /100 | #193 | Fair 89.5% |
| Immigrants from Eritrea | 33.2 /100 | #194 | Fair 89.4% |
| Immigrants from Armenia | 31.8 /100 | #195 | Fair 89.4% |
| Crow | 24.3 /100 | #196 | Fair 89.3% |
| Immigrants from Sweden | 23.6 /100 | #197 | Fair 89.3% |
| Pennsylvania Germans | 22.9 /100 | #198 | Fair 89.3% |
| Immigrants from Asia | 22.8 /100 | #199 | Fair 89.3% |
| Central Americans | 21.4 /100 | #200 | Fair 89.2% |
| Immigrants from Western Europe | 20.5 /100 | #201 | Fair 89.2% |
| Iroquois | 19.8 /100 | #202 | Poor 89.2% |
| Cambodians | 18.9 /100 | #203 | Poor 89.2% |
| Romanians | 18.2 /100 | #204 | Poor 89.2% |
Immigrants from Sweden 1 or more Vehicles in Household Correlation Summary
| Measurement | Immigrants from Sweden Data | 1 or more Vehicles in Household Data |
| Minimum | 0.033% | 86.1% |
| Maximum | 25.9% | 100.0% |
| Range | 25.9% | 13.9% |
| Mean | 3.8% | 96.5% |
| Median | 2.2% | 97.9% |
| Interquartile 25% (IQ1) | 1.1% | 94.0% |
| Interquartile 75% (IQ3) | 4.3% | 100.0% |
| Interquartile Range (IQR) | 3.2% | 6.0% |
| Standard Deviation (Sample) | 4.9% | 4.0% |
| Standard Deviation (Population) | 4.8% | 3.9% |
Correlation Details
| Immigrants from Sweden Percentile | Sample Size | 1 or more Vehicles in Household |
[ 0.0% - 0.5% ] 0.033% | 150,988,093 | 87.5% |
[ 0.0% - 0.5% ] 0.18% | 9,521,763 | 91.3% |
[ 0.0% - 0.5% ] 0.31% | 2,614,374 | 90.4% |
[ 0.0% - 0.5% ] 0.43% | 824,156 | 92.7% |
[ 0.5% - 1.0% ] 0.59% | 258,225 | 94.0% |
[ 0.5% - 1.0% ] 0.69% | 206,502 | 86.1% |
[ 0.5% - 1.0% ] 0.82% | 76,074 | 95.8% |
[ 0.5% - 1.0% ] 0.99% | 49,768 | 96.1% |
[ 1.0% - 1.5% ] 1.13% | 38,172 | 91.8% |
[ 1.0% - 1.5% ] 1.22% | 32,660 | 97.8% |
[ 1.0% - 1.5% ] 1.36% | 35,508 | 97.3% |
[ 1.0% - 1.5% ] 1.50% | 10,682 | 98.0% |
[ 1.5% - 2.0% ] 1.62% | 15,084 | 97.6% |
[ 1.5% - 2.0% ] 1.75% | 15,169 | 97.6% |
[ 1.5% - 2.0% ] 1.91% | 733 | 99.2% |
[ 2.0% - 2.5% ] 2.03% | 5,479 | 98.1% |
[ 2.0% - 2.5% ] 2.16% | 1,667 | 91.9% |
[ 2.0% - 2.5% ] 2.30% | 348 | 99.3% |
[ 2.0% - 2.5% ] 2.43% | 658 | 100.0% |
[ 2.5% - 3.0% ] 2.55% | 274 | 100.0% |
[ 2.5% - 3.0% ] 2.83% | 989 | 91.4% |
[ 3.0% - 3.5% ] 3.13% | 1,855 | 99.6% |
[ 3.0% - 3.5% ] 3.49% | 716 | 100.0% |
[ 3.5% - 4.0% ] 3.97% | 3,956 | 98.2% |
[ 4.0% - 4.5% ] 4.13% | 508 | 100.0% |
[ 4.0% - 4.5% ] 4.29% | 210 | 100.0% |
[ 4.0% - 4.5% ] 4.46% | 381 | 100.0% |
[ 4.5% - 5.0% ] 4.71% | 1,231 | 94.9% |
[ 6.5% - 7.0% ] 6.99% | 229 | 100.0% |
[ 7.0% - 7.5% ] 7.07% | 198 | 100.0% |
[ 7.0% - 7.5% ] 7.30% | 178 | 100.0% |
[ 10.5% - 11.0% ] 10.53% | 57 | 100.0% |
[ 12.5% - 13.0% ] 12.72% | 456 | 95.7% |
[ 25.5% - 26.0% ] 25.95% | 185 | 100.0% |