Subsaharan African Unemployment Among Women with Children Ages 6 to 17 years
COMPARE
Subsaharan African
Select to Compare
Unemployment Among Women with Children Ages 6 to 17 years
Subsaharan African Unemployment Among Women with Children Ages 6 to 17 years
10.0%
UNEMPLOYMENT | WOMEN W/ CHILDREN 6 TO 17
0.0/ 100
METRIC RATING
290th/ 347
METRIC RANK
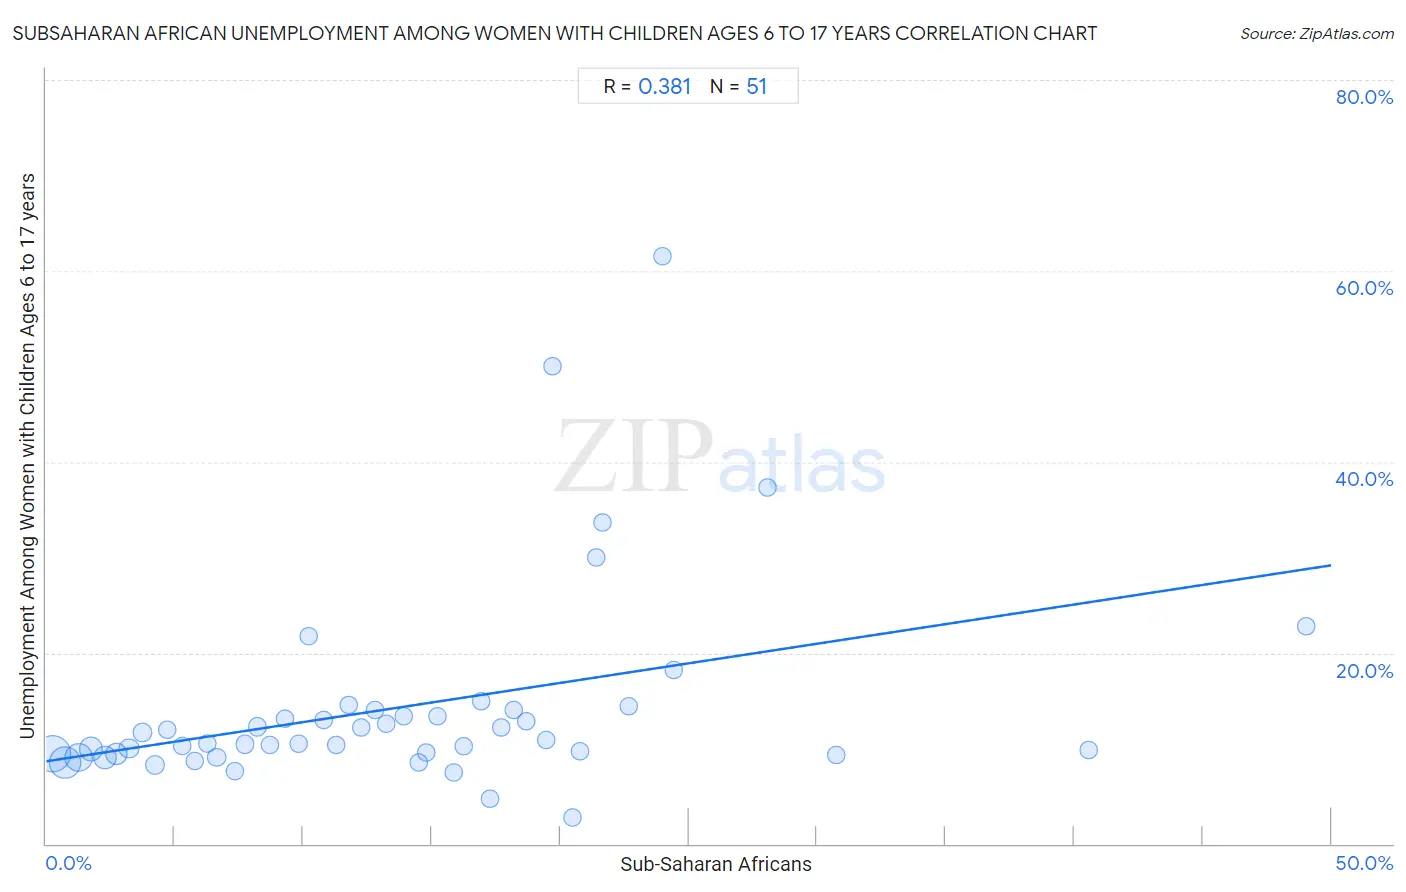
Subsaharan African Unemployment Among Women with Children Ages 6 to 17 years Correlation Chart
The statistical analysis conducted on geographies consisting of 345,149,119 people shows a mild positive correlation between the proportion of Sub-Saharan Africans and unemployment rate among women with children between the ages 6 and 17 in the United States with a correlation coefficient (R) of 0.381 and weighted average of 10.0%. On average, for every 1% (one percent) increase in Sub-Saharan Africans within a typical geography, there is an increase of 0.41% in unemployment rate among women with children between the ages 6 and 17.
It is essential to understand that the correlation between the percentage of Sub-Saharan Africans and unemployment rate among women with children between the ages 6 and 17 does not imply a direct cause-and-effect relationship. It remains uncertain whether the presence of Sub-Saharan Africans influences an upward or downward trend in the level of unemployment rate among women with children between the ages 6 and 17 within an area, or if Sub-Saharan Africans simply ended up residing in those areas with higher or lower levels of unemployment rate among women with children between the ages 6 and 17 due to other factors.
Demographics Similar to Sub-Saharan Africans by Unemployment Among Women with Children Ages 6 to 17 years
In terms of unemployment among women with children ages 6 to 17 years, the demographic groups most similar to Sub-Saharan Africans are Honduran (10.0%, a difference of 0.010%), Nonimmigrants (10.0%, a difference of 0.020%), Carpatho Rusyn (10.0%, a difference of 0.030%), Haitian (10.0%, a difference of 0.12%), and Ecuadorian (10.0%, a difference of 0.22%).
| Demographics | Rating | Rank | Unemployment Among Women with Children Ages 6 to 17 years |
| Central American Indians | 0.0 /100 | #283 | Tragic 9.9% |
| Yakama | 0.0 /100 | #284 | Tragic 9.9% |
| Hispanics or Latinos | 0.0 /100 | #285 | Tragic 9.9% |
| Choctaw | 0.0 /100 | #286 | Tragic 9.9% |
| Sierra Leoneans | 0.0 /100 | #287 | Tragic 9.9% |
| Shoshone | 0.0 /100 | #288 | Tragic 10.0% |
| Hondurans | 0.0 /100 | #289 | Tragic 10.0% |
| Sub-Saharan Africans | 0.0 /100 | #290 | Tragic 10.0% |
| Nonimmigrants | 0.0 /100 | #291 | Tragic 10.0% |
| Carpatho Rusyns | 0.0 /100 | #292 | Tragic 10.0% |
| Haitians | 0.0 /100 | #293 | Tragic 10.0% |
| Ecuadorians | 0.0 /100 | #294 | Tragic 10.0% |
| Cherokee | 0.0 /100 | #295 | Tragic 10.0% |
| Immigrants from Western Africa | 0.0 /100 | #296 | Tragic 10.1% |
| Immigrants from Caribbean | 0.0 /100 | #297 | Tragic 10.1% |
Subsaharan African Unemployment Among Women with Children Ages 6 to 17 years Correlation Summary
| Measurement | Subsaharan African Data | Unemployment Among Women with Children Ages 6 to 17 years Data |
| Minimum | 0.25% | 2.8% |
| Maximum | 49.0% | 61.5% |
| Range | 48.8% | 58.7% |
| Mean | 13.8% | 14.3% |
| Median | 12.8% | 10.5% |
| Interquartile 25% (IQ1) | 6.3% | 9.4% |
| Interquartile 75% (IQ3) | 19.4% | 14.0% |
| Interquartile Range (IQR) | 13.2% | 4.6% |
| Standard Deviation (Sample) | 9.9% | 10.6% |
| Standard Deviation (Population) | 9.8% | 10.5% |
Correlation Details
| Subsaharan African Percentile | Sample Size | Unemployment Among Women with Children Ages 6 to 17 years |
[ 0.0% - 0.5% ] 0.25% | 99,136,336 | 9.4% |
[ 0.5% - 1.0% ] 0.73% | 71,931,845 | 8.5% |
[ 1.0% - 1.5% ] 1.25% | 53,946,415 | 9.1% |
[ 1.5% - 2.0% ] 1.73% | 30,071,934 | 9.9% |
[ 2.0% - 2.5% ] 2.26% | 26,421,530 | 9.1% |
[ 2.5% - 3.0% ] 2.72% | 18,477,105 | 9.4% |
[ 3.0% - 3.5% ] 3.23% | 10,122,959 | 10.0% |
[ 3.5% - 4.0% ] 3.75% | 7,061,147 | 11.7% |
[ 4.0% - 4.5% ] 4.22% | 7,056,111 | 8.3% |
[ 4.5% - 5.0% ] 4.70% | 2,853,285 | 12.0% |
[ 5.0% - 5.5% ] 5.30% | 2,929,528 | 10.3% |
[ 5.5% - 6.0% ] 5.78% | 2,660,741 | 8.7% |
[ 6.0% - 6.5% ] 6.26% | 1,678,255 | 10.5% |
[ 6.5% - 7.0% ] 6.64% | 2,043,868 | 9.0% |
[ 7.0% - 7.5% ] 7.35% | 1,204,759 | 7.6% |
[ 7.5% - 8.0% ] 7.73% | 1,065,579 | 10.4% |
[ 8.0% - 8.5% ] 8.23% | 665,151 | 12.2% |
[ 8.5% - 9.0% ] 8.71% | 757,351 | 10.4% |
[ 9.0% - 9.5% ] 9.27% | 711,443 | 13.1% |
[ 9.5% - 10.0% ] 9.83% | 254,410 | 10.5% |
[ 10.0% - 10.5% ] 10.21% | 642,080 | 21.8% |
[ 10.5% - 11.0% ] 10.80% | 354,594 | 13.0% |
[ 11.0% - 11.5% ] 11.27% | 575,980 | 10.3% |
[ 11.5% - 12.0% ] 11.76% | 169,359 | 14.6% |
[ 12.0% - 12.5% ] 12.26% | 69,204 | 12.2% |
[ 12.5% - 13.0% ] 12.80% | 149,882 | 14.0% |
[ 13.0% - 13.5% ] 13.21% | 289,117 | 12.5% |
[ 13.5% - 14.0% ] 13.92% | 286,865 | 13.4% |
[ 14.0% - 14.5% ] 14.48% | 51,345 | 8.5% |
[ 14.5% - 15.0% ] 14.79% | 62,888 | 9.6% |
[ 15.0% - 15.5% ] 15.20% | 205,458 | 13.4% |
[ 15.5% - 16.0% ] 15.84% | 165,174 | 7.5% |
[ 16.0% - 16.5% ] 16.26% | 164,849 | 10.2% |
[ 16.5% - 17.0% ] 16.92% | 21,503 | 14.9% |
[ 17.0% - 17.5% ] 17.25% | 45,526 | 4.7% |
[ 17.5% - 18.0% ] 17.72% | 59,088 | 12.1% |
[ 18.0% - 18.5% ] 18.20% | 213,855 | 14.0% |
[ 18.5% - 19.0% ] 18.66% | 91,718 | 12.9% |
[ 19.0% - 19.5% ] 19.43% | 241,617 | 10.9% |
[ 19.5% - 20.0% ] 19.68% | 935 | 50.0% |
[ 20.0% - 20.5% ] 20.47% | 25,823 | 2.8% |
[ 20.5% - 21.0% ] 20.76% | 25,987 | 9.7% |
[ 21.0% - 21.5% ] 21.39% | 4,961 | 30.0% |
[ 21.5% - 22.0% ] 21.63% | 41,700 | 33.7% |
[ 22.5% - 23.0% ] 22.67% | 36,984 | 14.4% |
[ 23.5% - 24.0% ] 23.99% | 14,553 | 61.5% |
[ 24.0% - 24.5% ] 24.44% | 24,795 | 18.2% |
[ 28.0% - 28.5% ] 28.05% | 29,533 | 37.3% |
[ 30.5% - 31.0% ] 30.74% | 15,489 | 9.3% |
[ 40.5% - 41.0% ] 40.56% | 9,613 | 9.8% |
[ 49.0% - 49.5% ] 49.01% | 8,892 | 22.8% |