Immigrants from England 1 or more Vehicles in Household
COMPARE
Immigrants from England
Select to Compare
1 or more Vehicles in Household
Immigrants from England 1 or more Vehicles in Household
91.4%
1+ VEHICLES AVAILABLE
99.3/ 100
METRIC RATING
83rd/ 347
METRIC RANK
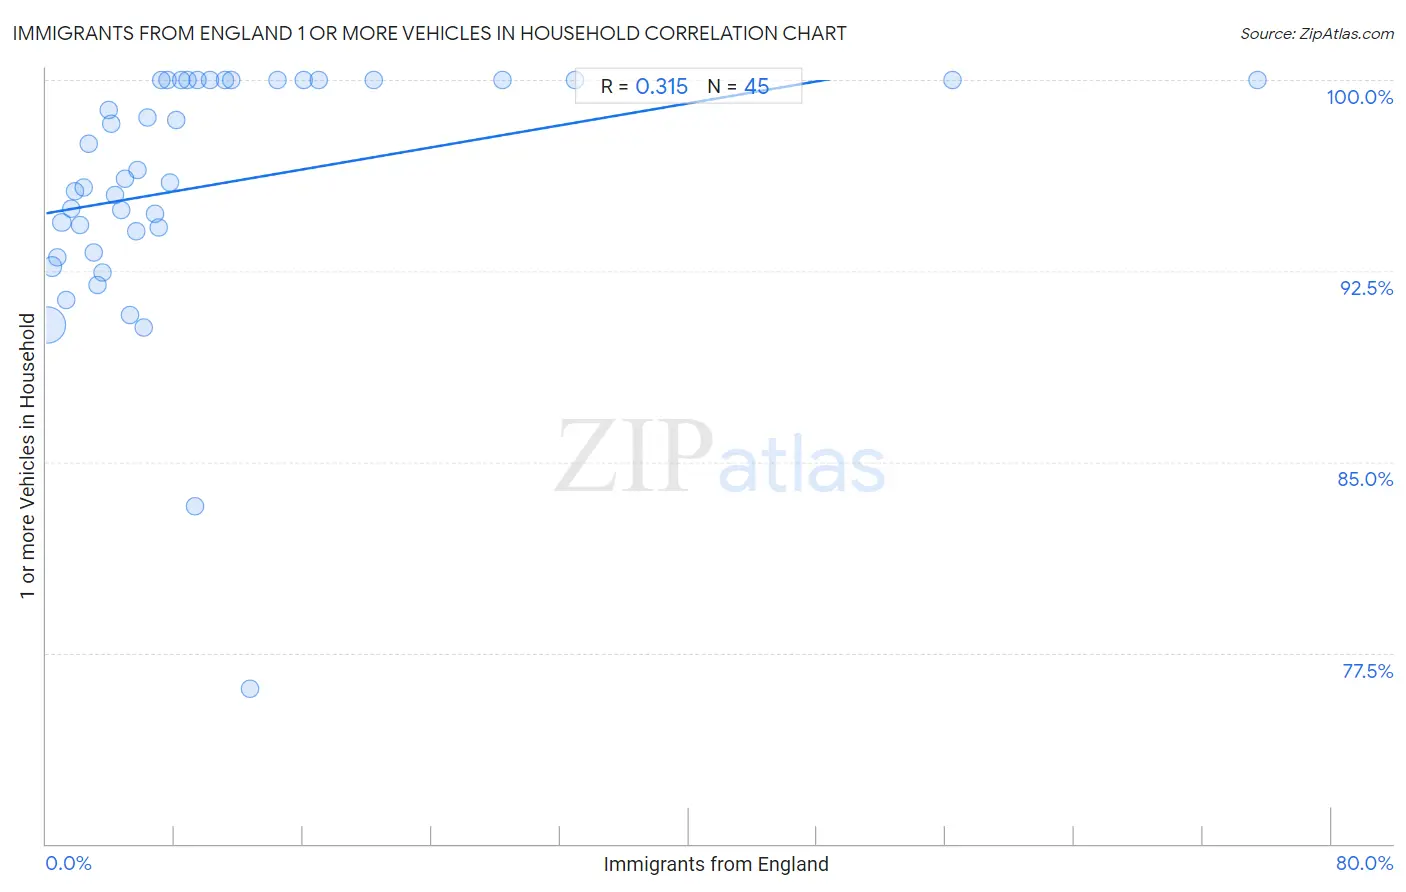
Immigrants from England 1 or more Vehicles in Household Correlation Chart
The statistical analysis conducted on geographies consisting of 391,777,115 people shows a mild positive correlation between the proportion of Immigrants from England and percentage of households with 1 or more vehicles available in the United States with a correlation coefficient (R) of 0.315 and weighted average of 91.4%. On average, for every 1% (one percent) increase in Immigrants from England within a typical geography, there is an increase of 0.11% in percentage of households with 1 or more vehicles available.
It is essential to understand that the correlation between the percentage of Immigrants from England and percentage of households with 1 or more vehicles available does not imply a direct cause-and-effect relationship. It remains uncertain whether the presence of Immigrants from England influences an upward or downward trend in the level of percentage of households with 1 or more vehicles available within an area, or if Immigrants from England simply ended up residing in those areas with higher or lower levels of percentage of households with 1 or more vehicles available due to other factors.
Demographics Similar to Immigrants from England by 1 or more Vehicles in Household
In terms of 1 or more vehicles in household, the demographic groups most similar to Immigrants from England are Lebanese (91.4%, a difference of 0.0%), Immigrants from South Eastern Asia (91.4%, a difference of 0.010%), Jordanian (91.4%, a difference of 0.010%), Tsimshian (91.4%, a difference of 0.020%), and Bolivian (91.5%, a difference of 0.040%).
| Demographics | Rating | Rank | 1 or more Vehicles in Household |
| Cubans | 99.5 /100 | #76 | Exceptional 91.5% |
| Immigrants from Philippines | 99.4 /100 | #77 | Exceptional 91.5% |
| Iranians | 99.4 /100 | #78 | Exceptional 91.5% |
| Immigrants from South Central Asia | 99.4 /100 | #79 | Exceptional 91.5% |
| Bolivians | 99.4 /100 | #80 | Exceptional 91.5% |
| Immigrants from South Eastern Asia | 99.3 /100 | #81 | Exceptional 91.4% |
| Lebanese | 99.3 /100 | #82 | Exceptional 91.4% |
| Immigrants from England | 99.3 /100 | #83 | Exceptional 91.4% |
| Jordanians | 99.3 /100 | #84 | Exceptional 91.4% |
| Tsimshian | 99.3 /100 | #85 | Exceptional 91.4% |
| Osage | 99.2 /100 | #86 | Exceptional 91.4% |
| Immigrants from Germany | 99.2 /100 | #87 | Exceptional 91.4% |
| Spanish Americans | 99.2 /100 | #88 | Exceptional 91.4% |
| Bangladeshis | 99.2 /100 | #89 | Exceptional 91.4% |
| Immigrants from Canada | 99.2 /100 | #90 | Exceptional 91.4% |
Immigrants from England 1 or more Vehicles in Household Correlation Summary
| Measurement | Immigrants from England Data | 1 or more Vehicles in Household Data |
| Minimum | 0.098% | 76.1% |
| Maximum | 75.4% | 100.0% |
| Range | 75.3% | 23.9% |
| Mean | 10.2% | 95.9% |
| Median | 6.3% | 96.1% |
| Interquartile 25% (IQ1) | 3.1% | 93.6% |
| Interquartile 75% (IQ3) | 10.7% | 100.0% |
| Interquartile Range (IQR) | 7.5% | 6.4% |
| Standard Deviation (Sample) | 14.1% | 4.8% |
| Standard Deviation (Population) | 13.9% | 4.8% |
Correlation Details
| Immigrants from England Percentile | Sample Size | 1 or more Vehicles in Household |
[ 0.0% - 0.5% ] 0.098% | 347,284,022 | 90.4% |
[ 0.0% - 0.5% ] 0.38% | 34,770,728 | 92.7% |
[ 0.5% - 1.0% ] 0.68% | 6,505,781 | 93.0% |
[ 0.5% - 1.0% ] 0.97% | 1,740,016 | 94.4% |
[ 1.0% - 1.5% ] 1.23% | 707,625 | 91.4% |
[ 1.5% - 2.0% ] 1.53% | 306,742 | 94.9% |
[ 1.5% - 2.0% ] 1.82% | 147,133 | 95.7% |
[ 2.0% - 2.5% ] 2.11% | 69,030 | 94.3% |
[ 2.0% - 2.5% ] 2.36% | 59,213 | 95.8% |
[ 2.5% - 3.0% ] 2.66% | 31,688 | 97.5% |
[ 2.5% - 3.0% ] 2.98% | 35,877 | 93.2% |
[ 3.0% - 3.5% ] 3.23% | 22,799 | 91.9% |
[ 3.0% - 3.5% ] 3.50% | 13,001 | 92.4% |
[ 3.5% - 4.0% ] 3.87% | 6,843 | 98.8% |
[ 4.0% - 4.5% ] 4.08% | 9,316 | 98.3% |
[ 4.0% - 4.5% ] 4.31% | 18,297 | 95.5% |
[ 4.5% - 5.0% ] 4.66% | 17,878 | 94.9% |
[ 4.5% - 5.0% ] 4.93% | 9,495 | 96.1% |
[ 5.0% - 5.5% ] 5.21% | 4,049 | 90.8% |
[ 5.5% - 6.0% ] 5.57% | 4,041 | 94.1% |
[ 5.5% - 6.0% ] 5.70% | 2,685 | 96.5% |
[ 6.0% - 6.5% ] 6.06% | 1,287 | 90.3% |
[ 6.0% - 6.5% ] 6.31% | 634 | 98.6% |
[ 6.5% - 7.0% ] 6.73% | 594 | 94.7% |
[ 6.5% - 7.0% ] 6.97% | 1,219 | 94.2% |
[ 7.0% - 7.5% ] 7.19% | 139 | 100.0% |
[ 7.5% - 8.0% ] 7.54% | 491 | 100.0% |
[ 7.5% - 8.0% ] 7.71% | 389 | 96.0% |
[ 8.0% - 8.5% ] 8.08% | 582 | 98.4% |
[ 8.0% - 8.5% ] 8.41% | 345 | 100.0% |
[ 8.5% - 9.0% ] 8.78% | 467 | 100.0% |
[ 9.0% - 9.5% ] 9.26% | 993 | 83.3% |
[ 9.0% - 9.5% ] 9.41% | 871 | 100.0% |
[ 10.0% - 10.5% ] 10.20% | 461 | 100.0% |
[ 11.0% - 11.5% ] 11.11% | 45 | 100.0% |
[ 11.5% - 12.0% ] 11.54% | 156 | 100.0% |
[ 12.5% - 13.0% ] 12.71% | 291 | 76.1% |
[ 14.0% - 14.5% ] 14.36% | 188 | 100.0% |
[ 16.0% - 16.5% ] 16.04% | 636 | 100.0% |
[ 16.5% - 17.0% ] 16.98% | 106 | 100.0% |
[ 20.0% - 20.5% ] 20.39% | 152 | 100.0% |
[ 28.0% - 28.5% ] 28.41% | 88 | 100.0% |
[ 32.5% - 33.0% ] 32.92% | 161 | 100.0% |
[ 56.0% - 56.5% ] 56.39% | 321 | 100.0% |
[ 75.0% - 75.5% ] 75.42% | 240 | 100.0% |