Pueblo 1 or more Vehicles in Household
COMPARE
Pueblo
Select to Compare
1 or more Vehicles in Household
Pueblo 1 or more Vehicles in Household
89.6%
1+ VEHICLES AVAILABLE
39.9/ 100
METRIC RATING
186th/ 347
METRIC RANK
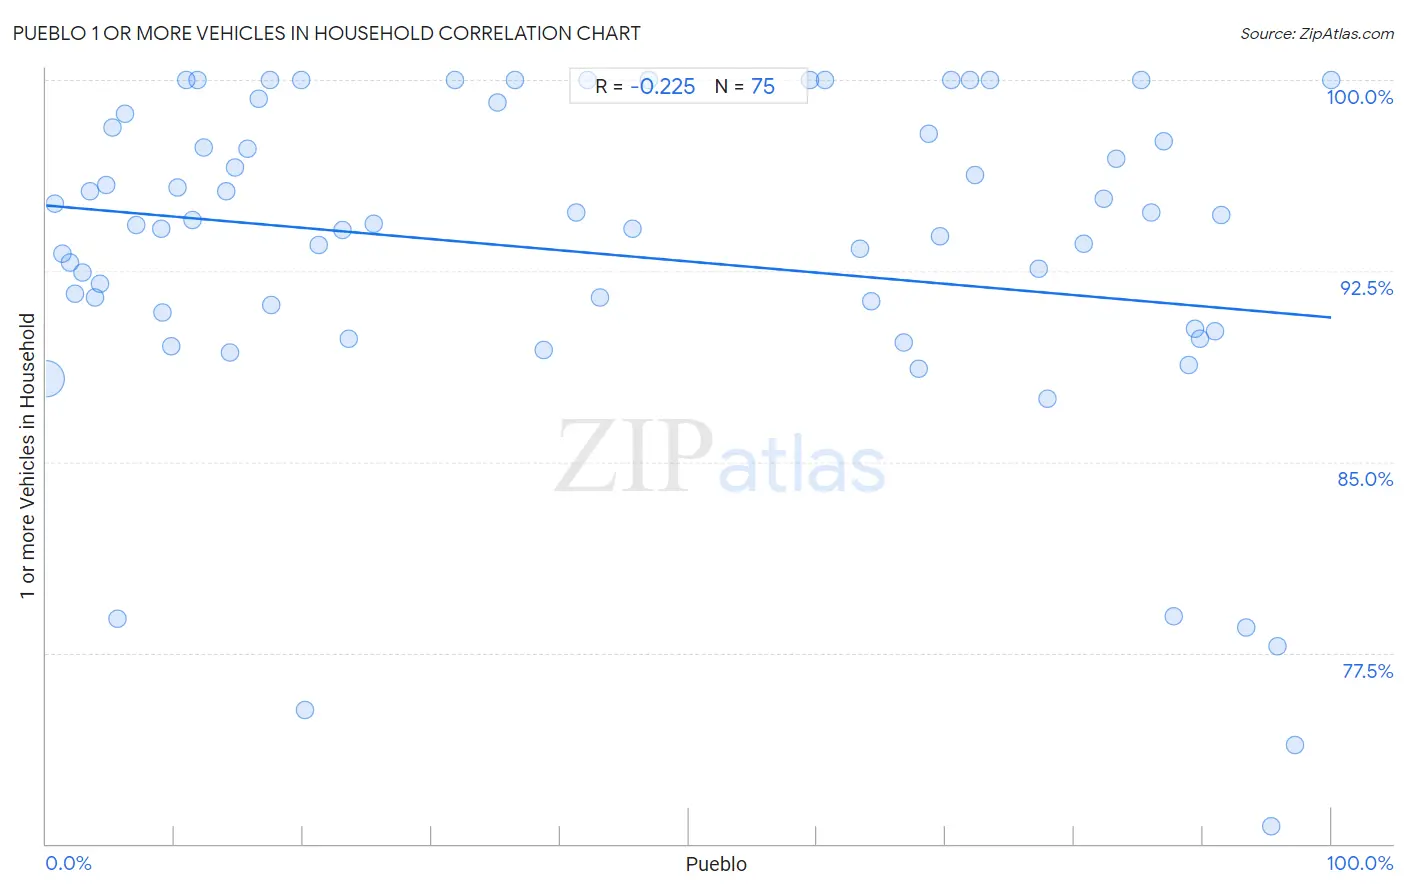
Pueblo 1 or more Vehicles in Household Correlation Chart
The statistical analysis conducted on geographies consisting of 120,072,520 people shows a weak negative correlation between the proportion of Pueblo and percentage of households with 1 or more vehicles available in the United States with a correlation coefficient (R) of -0.225 and weighted average of 89.6%. On average, for every 1% (one percent) increase in Pueblo within a typical geography, there is a decrease of 0.044% in percentage of households with 1 or more vehicles available.
It is essential to understand that the correlation between the percentage of Pueblo and percentage of households with 1 or more vehicles available does not imply a direct cause-and-effect relationship. It remains uncertain whether the presence of Pueblo influences an upward or downward trend in the level of percentage of households with 1 or more vehicles available within an area, or if Pueblo simply ended up residing in those areas with higher or lower levels of percentage of households with 1 or more vehicles available due to other factors.
Demographics Similar to Pueblo by 1 or more Vehicles in Household
In terms of 1 or more vehicles in household, the demographic groups most similar to Pueblo are Immigrants from Brazil (89.6%, a difference of 0.0%), Immigrants from Bulgaria (89.6%, a difference of 0.010%), South American (89.5%, a difference of 0.010%), Ethiopian (89.6%, a difference of 0.020%), and Immigrants from Nepal (89.5%, a difference of 0.020%).
| Demographics | Rating | Rank | 1 or more Vehicles in Household |
| German Russians | 44.0 /100 | #179 | Average 89.6% |
| Arabs | 43.3 /100 | #180 | Average 89.6% |
| Immigrants from Ethiopia | 42.5 /100 | #181 | Average 89.6% |
| Ukrainians | 42.4 /100 | #182 | Average 89.6% |
| Ethiopians | 41.2 /100 | #183 | Average 89.6% |
| Immigrants from Bulgaria | 40.7 /100 | #184 | Average 89.6% |
| Immigrants from Brazil | 40.1 /100 | #185 | Average 89.6% |
| Pueblo | 39.9 /100 | #186 | Fair 89.6% |
| South Americans | 39.6 /100 | #187 | Fair 89.5% |
| Immigrants from Nepal | 38.9 /100 | #188 | Fair 89.5% |
| Carpatho Rusyns | 37.8 /100 | #189 | Fair 89.5% |
| Shoshone | 37.5 /100 | #190 | Fair 89.5% |
| Immigrants from Poland | 37.1 /100 | #191 | Fair 89.5% |
| Immigrants from North Macedonia | 36.5 /100 | #192 | Fair 89.5% |
| Immigrants from Northern Europe | 35.5 /100 | #193 | Fair 89.5% |
Pueblo 1 or more Vehicles in Household Correlation Summary
| Measurement | Pueblo Data | 1 or more Vehicles in Household Data |
| Minimum | 0.045% | 70.7% |
| Maximum | 100.0% | 100.0% |
| Range | 100.0% | 29.3% |
| Mean | 43.0% | 93.2% |
| Median | 36.4% | 94.3% |
| Interquartile 25% (IQ1) | 10.9% | 90.2% |
| Interquartile 75% (IQ3) | 77.3% | 98.2% |
| Interquartile Range (IQR) | 66.4% | 7.9% |
| Standard Deviation (Sample) | 34.0% | 6.6% |
| Standard Deviation (Population) | 33.8% | 6.6% |
Correlation Details
| Pueblo Percentile | Sample Size | 1 or more Vehicles in Household |
[ 0.0% - 0.5% ] 0.045% | 116,673,599 | 88.2% |
[ 0.5% - 1.0% ] 0.68% | 1,454,581 | 95.2% |
[ 1.0% - 1.5% ] 1.28% | 1,224,263 | 93.2% |
[ 1.5% - 2.0% ] 1.81% | 266,384 | 92.8% |
[ 2.0% - 2.5% ] 2.21% | 31,337 | 91.6% |
[ 2.5% - 3.0% ] 2.85% | 102,313 | 92.5% |
[ 3.0% - 3.5% ] 3.38% | 7,357 | 95.6% |
[ 3.5% - 4.0% ] 3.77% | 11,232 | 91.4% |
[ 4.0% - 4.5% ] 4.18% | 120,437 | 92.0% |
[ 4.5% - 5.0% ] 4.64% | 11,534 | 95.9% |
[ 5.0% - 5.5% ] 5.20% | 7,505 | 98.2% |
[ 5.5% - 6.0% ] 5.53% | 1,646 | 78.8% |
[ 6.0% - 6.5% ] 6.10% | 2,902 | 98.7% |
[ 7.0% - 7.5% ] 7.00% | 20,354 | 94.3% |
[ 8.5% - 9.0% ] 8.91% | 18,479 | 94.1% |
[ 9.0% - 9.5% ] 9.00% | 422 | 90.8% |
[ 9.5% - 10.0% ] 9.69% | 1,063 | 89.5% |
[ 10.0% - 10.5% ] 10.17% | 423 | 95.8% |
[ 10.5% - 11.0% ] 10.91% | 1,549 | 100.0% |
[ 11.0% - 11.5% ] 11.40% | 1,790 | 94.5% |
[ 11.5% - 12.0% ] 11.81% | 237 | 100.0% |
[ 12.0% - 12.5% ] 12.24% | 776 | 97.4% |
[ 13.5% - 14.0% ] 13.97% | 11,614 | 95.6% |
[ 14.0% - 14.5% ] 14.30% | 3,894 | 89.3% |
[ 14.5% - 15.0% ] 14.72% | 15,895 | 96.6% |
[ 15.5% - 16.0% ] 15.69% | 1,472 | 97.3% |
[ 16.5% - 17.0% ] 16.52% | 932 | 99.3% |
[ 17.0% - 17.5% ] 17.42% | 310 | 100.0% |
[ 17.5% - 18.0% ] 17.50% | 1,914 | 91.2% |
[ 19.5% - 20.0% ] 19.86% | 287 | 100.0% |
[ 20.0% - 20.5% ] 20.14% | 422 | 75.3% |
[ 21.0% - 21.5% ] 21.20% | 2,165 | 93.5% |
[ 23.0% - 23.5% ] 23.03% | 2,336 | 94.1% |
[ 23.5% - 24.0% ] 23.58% | 971 | 89.8% |
[ 25.5% - 26.0% ] 25.52% | 5,675 | 94.3% |
[ 31.5% - 32.0% ] 31.81% | 591 | 100.0% |
[ 35.0% - 35.5% ] 35.16% | 219 | 99.1% |
[ 36.0% - 36.5% ] 36.43% | 516 | 100.0% |
[ 38.5% - 39.0% ] 38.72% | 3,817 | 89.4% |
[ 41.0% - 41.5% ] 41.23% | 2,906 | 94.8% |
[ 42.0% - 42.5% ] 42.11% | 38 | 100.0% |
[ 43.0% - 43.5% ] 43.06% | 922 | 91.5% |
[ 45.5% - 46.0% ] 45.60% | 728 | 94.2% |
[ 46.5% - 47.0% ] 46.84% | 459 | 100.0% |
[ 59.0% - 59.5% ] 59.41% | 340 | 100.0% |
[ 60.5% - 61.0% ] 60.63% | 1,270 | 100.0% |
[ 63.0% - 63.5% ] 63.32% | 2,841 | 93.4% |
[ 64.0% - 64.5% ] 64.25% | 3,393 | 91.3% |
[ 66.5% - 67.0% ] 66.75% | 2,021 | 89.7% |
[ 67.5% - 68.0% ] 67.86% | 1,422 | 88.7% |
[ 68.5% - 69.0% ] 68.70% | 722 | 97.9% |
[ 69.5% - 70.0% ] 69.51% | 515 | 93.9% |
[ 70.0% - 70.5% ] 70.40% | 125 | 100.0% |
[ 71.5% - 72.0% ] 71.93% | 57 | 100.0% |
[ 72.0% - 72.5% ] 72.28% | 1,349 | 96.2% |
[ 73.0% - 73.5% ] 73.48% | 230 | 100.0% |
[ 77.0% - 77.5% ] 77.26% | 5,520 | 92.6% |
[ 77.5% - 78.0% ] 77.96% | 481 | 87.5% |
[ 80.5% - 81.0% ] 80.72% | 1,006 | 93.6% |
[ 82.0% - 82.5% ] 82.27% | 1,173 | 95.3% |
[ 83.0% - 83.5% ] 83.30% | 886 | 96.9% |
[ 85.0% - 85.5% ] 85.19% | 574 | 100.0% |
[ 85.5% - 86.0% ] 85.97% | 1,283 | 94.8% |
[ 86.5% - 87.0% ] 86.99% | 1,430 | 97.6% |
[ 87.5% - 88.0% ] 87.77% | 229 | 78.9% |
[ 88.5% - 89.0% ] 88.93% | 1,824 | 88.8% |
[ 89.0% - 89.5% ] 89.37% | 2,070 | 90.2% |
[ 89.5% - 90.0% ] 89.82% | 1,877 | 89.8% |
[ 90.5% - 91.0% ] 90.94% | 1,743 | 90.1% |
[ 91.0% - 91.5% ] 91.45% | 620 | 94.7% |
[ 93.0% - 93.5% ] 93.42% | 730 | 78.5% |
[ 95.0% - 95.5% ] 95.35% | 2,324 | 70.7% |
[ 95.5% - 96.0% ] 95.79% | 9,033 | 77.7% |
[ 97.0% - 97.5% ] 97.20% | 6,789 | 73.9% |
[ 99.5% - 100.0% ] 100.00% | 377 | 100.0% |