Alaska Native 1 or more Vehicles in Household
COMPARE
Alaska Native
Select to Compare
1 or more Vehicles in Household
Alaska Native 1 or more Vehicles in Household
83.8%
1+ VEHICLES AVAILABLE
0.0/ 100
METRIC RATING
316th/ 347
METRIC RANK
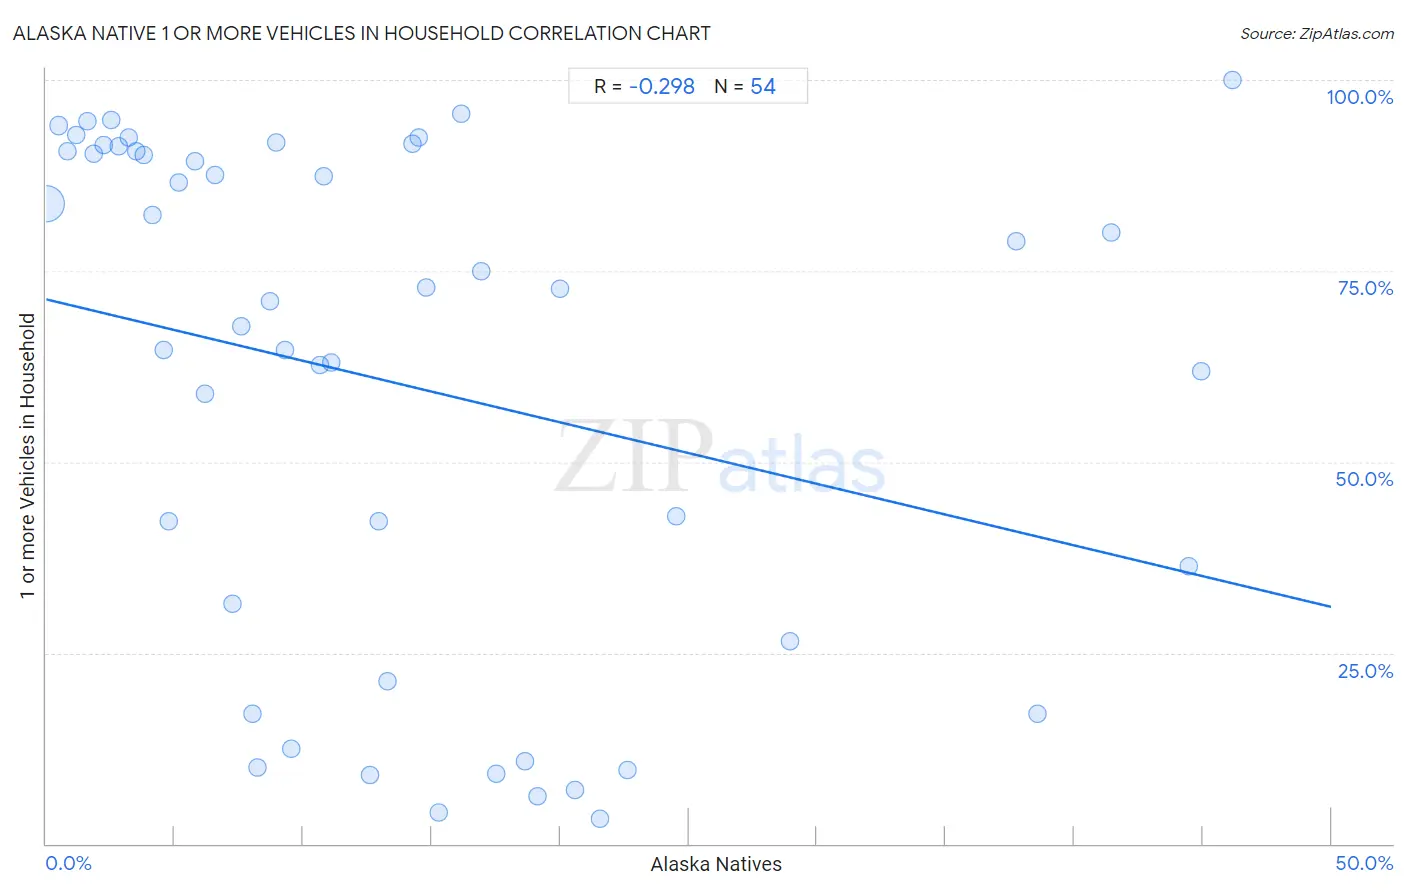
Alaska Native 1 or more Vehicles in Household Correlation Chart
The statistical analysis conducted on geographies consisting of 76,754,392 people shows a weak negative correlation between the proportion of Alaska Natives and percentage of households with 1 or more vehicles available in the United States with a correlation coefficient (R) of -0.298 and weighted average of 83.8%. On average, for every 1% (one percent) increase in Alaska Natives within a typical geography, there is a decrease of 0.81% in percentage of households with 1 or more vehicles available.
It is essential to understand that the correlation between the percentage of Alaska Natives and percentage of households with 1 or more vehicles available does not imply a direct cause-and-effect relationship. It remains uncertain whether the presence of Alaska Natives influences an upward or downward trend in the level of percentage of households with 1 or more vehicles available within an area, or if Alaska Natives simply ended up residing in those areas with higher or lower levels of percentage of households with 1 or more vehicles available due to other factors.
Demographics Similar to Alaska Natives by 1 or more Vehicles in Household
In terms of 1 or more vehicles in household, the demographic groups most similar to Alaska Natives are Ghanaian (83.6%, a difference of 0.22%), Immigrants from Ghana (83.4%, a difference of 0.42%), Immigrants from Belarus (83.3%, a difference of 0.55%), Cypriot (84.4%, a difference of 0.69%), and Albanian (84.4%, a difference of 0.76%).
| Demographics | Rating | Rank | 1 or more Vehicles in Household |
| Immigrants from Haiti | 0.0 /100 | #309 | Tragic 84.7% |
| U.S. Virgin Islanders | 0.0 /100 | #310 | Tragic 84.6% |
| Puerto Ricans | 0.0 /100 | #311 | Tragic 84.6% |
| Cape Verdeans | 0.0 /100 | #312 | Tragic 84.5% |
| Immigrants from Israel | 0.0 /100 | #313 | Tragic 84.5% |
| Albanians | 0.0 /100 | #314 | Tragic 84.4% |
| Cypriots | 0.0 /100 | #315 | Tragic 84.4% |
| Alaska Natives | 0.0 /100 | #316 | Tragic 83.8% |
| Ghanaians | 0.0 /100 | #317 | Tragic 83.6% |
| Immigrants from Ghana | 0.0 /100 | #318 | Tragic 83.4% |
| Immigrants from Belarus | 0.0 /100 | #319 | Tragic 83.3% |
| Soviet Union | 0.0 /100 | #320 | Tragic 82.7% |
| Jamaicans | 0.0 /100 | #321 | Tragic 82.1% |
| Immigrants from Cabo Verde | 0.0 /100 | #322 | Tragic 81.6% |
| Immigrants from Yemen | 0.0 /100 | #323 | Tragic 80.5% |
Alaska Native 1 or more Vehicles in Household Correlation Summary
| Measurement | Alaska Native Data | 1 or more Vehicles in Household Data |
| Minimum | 0.020% | 3.3% |
| Maximum | 46.2% | 100.0% |
| Range | 46.1% | 96.7% |
| Mean | 13.7% | 60.3% |
| Median | 10.1% | 71.9% |
| Interquartile 25% (IQ1) | 4.6% | 26.5% |
| Interquartile 75% (IQ3) | 18.6% | 90.6% |
| Interquartile Range (IQR) | 14.1% | 64.1% |
| Standard Deviation (Sample) | 12.3% | 33.2% |
| Standard Deviation (Population) | 12.2% | 32.9% |
Correlation Details
| Alaska Native Percentile | Sample Size | 1 or more Vehicles in Household |
[ 0.0% - 0.5% ] 0.020% | 74,733,860 | 83.8% |
[ 0.0% - 0.5% ] 0.47% | 572,453 | 94.0% |
[ 0.5% - 1.0% ] 0.81% | 107,392 | 90.7% |
[ 1.0% - 1.5% ] 1.17% | 160,004 | 92.8% |
[ 1.5% - 2.0% ] 1.61% | 442,307 | 94.7% |
[ 1.5% - 2.0% ] 1.85% | 110,172 | 90.4% |
[ 2.0% - 2.5% ] 2.24% | 135,927 | 91.5% |
[ 2.5% - 3.0% ] 2.55% | 93,808 | 94.8% |
[ 2.5% - 3.0% ] 2.81% | 106,439 | 91.3% |
[ 3.0% - 3.5% ] 3.22% | 57,315 | 92.4% |
[ 3.0% - 3.5% ] 3.48% | 111,167 | 90.6% |
[ 3.5% - 4.0% ] 3.77% | 26,339 | 90.2% |
[ 4.0% - 4.5% ] 4.14% | 35,270 | 82.4% |
[ 4.5% - 5.0% ] 4.56% | 11,330 | 64.6% |
[ 4.5% - 5.0% ] 4.79% | 1,378 | 42.2% |
[ 5.0% - 5.5% ] 5.15% | 8,636 | 86.6% |
[ 5.5% - 6.0% ] 5.78% | 329 | 89.3% |
[ 6.0% - 6.5% ] 6.19% | 1,712 | 58.9% |
[ 6.5% - 7.0% ] 6.58% | 471 | 87.5% |
[ 7.0% - 7.5% ] 7.22% | 2,893 | 31.4% |
[ 7.5% - 8.0% ] 7.60% | 803 | 67.8% |
[ 8.0% - 8.5% ] 8.05% | 174 | 17.1% |
[ 8.0% - 8.5% ] 8.20% | 256 | 10.0% |
[ 8.5% - 9.0% ] 8.69% | 1,128 | 71.0% |
[ 8.5% - 9.0% ] 8.96% | 2,969 | 91.9% |
[ 9.0% - 9.5% ] 9.29% | 560 | 64.7% |
[ 9.5% - 10.0% ] 9.55% | 220 | 12.5% |
[ 10.5% - 11.0% ] 10.66% | 544 | 62.6% |
[ 10.5% - 11.0% ] 10.79% | 1,668 | 87.3% |
[ 11.0% - 11.5% ] 11.11% | 144 | 63.0% |
[ 12.5% - 13.0% ] 12.61% | 444 | 9.0% |
[ 12.5% - 13.0% ] 12.95% | 2,077 | 42.2% |
[ 13.0% - 13.5% ] 13.26% | 558 | 21.3% |
[ 14.0% - 14.5% ] 14.23% | 843 | 91.6% |
[ 14.5% - 15.0% ] 14.52% | 248 | 92.4% |
[ 14.5% - 15.0% ] 14.78% | 9,863 | 72.8% |
[ 15.0% - 15.5% ] 15.25% | 2,714 | 4.0% |
[ 16.0% - 16.5% ] 16.13% | 155 | 95.5% |
[ 16.5% - 17.0% ] 16.91% | 272 | 75.0% |
[ 17.0% - 17.5% ] 17.50% | 40 | 9.1% |
[ 18.5% - 19.0% ] 18.64% | 236 | 10.8% |
[ 19.0% - 19.5% ] 19.12% | 68 | 6.2% |
[ 20.0% - 20.5% ] 20.00% | 60 | 72.7% |
[ 20.5% - 21.0% ] 20.60% | 2,554 | 7.1% |
[ 21.5% - 22.0% ] 21.55% | 1,828 | 3.3% |
[ 22.5% - 23.0% ] 22.63% | 760 | 9.6% |
[ 24.0% - 24.5% ] 24.49% | 690 | 42.9% |
[ 28.5% - 29.0% ] 28.92% | 830 | 26.5% |
[ 37.5% - 38.0% ] 37.76% | 98 | 78.9% |
[ 38.5% - 39.0% ] 38.57% | 1,768 | 17.0% |
[ 41.0% - 41.5% ] 41.44% | 222 | 80.0% |
[ 44.0% - 44.5% ] 44.44% | 54 | 36.4% |
[ 44.5% - 45.0% ] 44.94% | 316 | 61.9% |
[ 46.0% - 46.5% ] 46.15% | 26 | 100.0% |